Past IEM Features tagged: 2012
Accumulated days
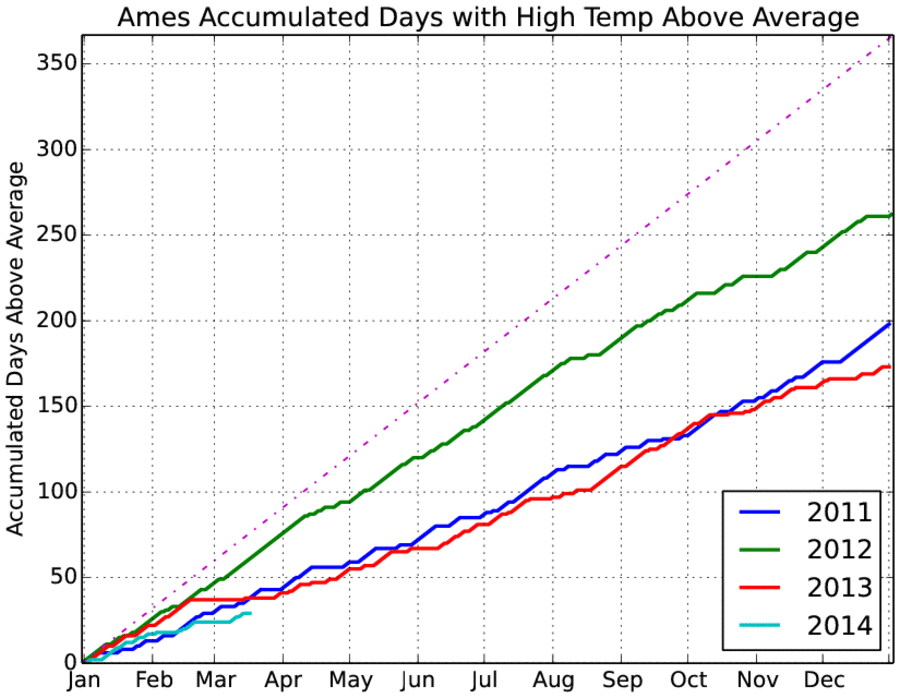
19 Mar 2014 05:43 AMThe featured map yesterday compared total number of days with above average high temperature so far this year over the Midwest. Today's chart shows the total number of days again with above average high temperature to date for the past four years. The dashed line would be having every day above average and it amazing to see 2012 so close to that line! This year's total has been much smaller than the previous three years and the forecast does not hold much hope to significantly adding to it.
Voting:
Good: 24
Bad: 8
Abstain: 6
Tags: 2012

Besting recent months in one day
05 Oct 2013 05:42 AMDes Moines received just over two inches of rainfall on Friday, which was almost larger than the individual monthly totals for each of the past three months! The featured chart presents the July, August, and September monthly totals for Des Moines along with the single day maximum precipitation for October during the same year. Both 2012 and 2013 have come close to exceeding a previous monthly total in just one day in October. The only year to accomplish this feat since 1880 was 1947!
Voting:
Good: 151
Bad: 9
Tags: 1947 2012 2013

Accumulated Precipitation
06 Sep 2013 05:44 AMWill 2013 be remembered for being a wet year or a dry year or both? The featured chart displays the statewide accumulated precipitation for this year, last year, 1993 (wettest year), and 1988 (driest year). The shading represents the range of values since 1893. Around the end of June, this year was the wettest to date on record, including 1993. The weather since then has been very dry and how the year to date accumulation is approaching merely average with 1993 some 15 inches higher! The forecast continues to hold little hope of widespread precipitation.
Voting:
Good: 146
Bad: 16
Tags: 2013 2012 1993 1988 precip

Net days above average
17 Apr 2013 04:40 AMOur weather has been on the cold side of average for much of the past two months. The featured chart shows the accumulated net number of days with a high temperature above average for Ames. The comparison between 2013 and 2012 ends around 17 February as about every day after that was above average in 2012 and most have been below this year. For this metric, 2012 was the most extreme year for net number of days above while 1979 had the most below. 1947 has the closest fit to this year and is shown as well. The cold weather looks to continue into next week.
Voting:
Good: 87
Bad: 9
Tags: 2012 2013 1979

Second Place for 2012
09 Jan 2013 05:34 AMThe National Climatic Data Center issued a report yesterday placing 2012 as the warmest year on record for the CONUS. While it was the warmest year for Des Moines, it was not the warmest for all sites in the state. The areal averaged temperature for Iowa came in a very close second place behind the year 1931. The featured image presents the year to date average temperature for 1931 and 2012 in the top chart and the monthly average temperature departures in the bottom chart. It is interesting to note how August for each year was similar and both very close to average. The last four months of the year show why 1931 was able to remain number one in Iowa. Please note that these numbers are IEM estimates and do not match the NCDC estimates, but we both have 2012 coming in second for Iowa.
Voting:
Good: 32
Bad: 6
Tags: 1931 2012

2012 in the books
01 Jan 2013 07:10 AM2012 will go down as one of the drier years on record for Iowa as shown by the featured graph of preliminary estimates for the state. This past year was the driest since the drought of 1988 with only a handful of other years drier since 1900. After four of the wettest years on record between 2007-2010, these past two have bucked the recent trend. While the calendar has changed, the drought of 2012 will roll on into 2013 and has near-zero chance of being busted before springtime.
Voting:
Good: 31
Bad: 2
Tags: 2012

2012: rewriting the record book
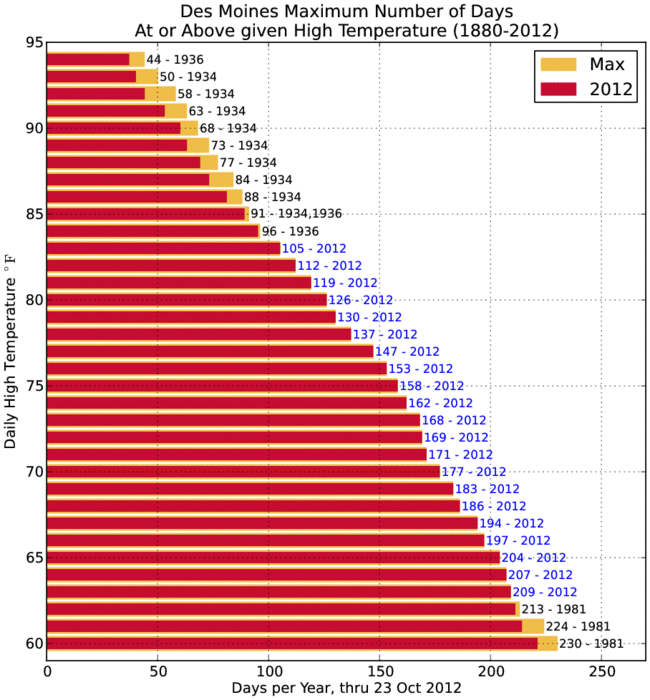
13 Dec 2012 05:39 AMWednesday was yet another very warm day this year with the high temperature for Des Moines reaching the 50s. The year 2012 continues to rewrite the temperature records as shown by the featured chart. The chart presents the record number of days per year at a given temperature threshold. This year owns almost all of the records and still has 18 days left to break some more records in the 40s. The forecast has a few more days of very warm weather and highs next week back into the 30s.
Voting:
Good: 25
Bad: 8
Tags: 2012

Lead Pipe Lock
05 Dec 2012 05:37 AMWhile some brief and very cold weather this fall cast some doubt on if 2012 would finish the warmest year on record for Des Moines, our recent stretch of very warm December weather has closed the deal. The featured chart presents our current year to date average temperature along with the current record of 1931. Each of the spaghetti lines represent a previous year's data projected onto the end of this year. All of the previous years now yield a 2012 ahead of 1931, so it is a lead pipe lock to win! Of course, we could loose if we tied record cold high and low temperatures each day (green line) until the end of the year! The bottom chart represents the scenario probability to date showing that we finally hit 100%!
Voting:
Good: 22
Bad: 4
Tags: 2012
Record December Warmth
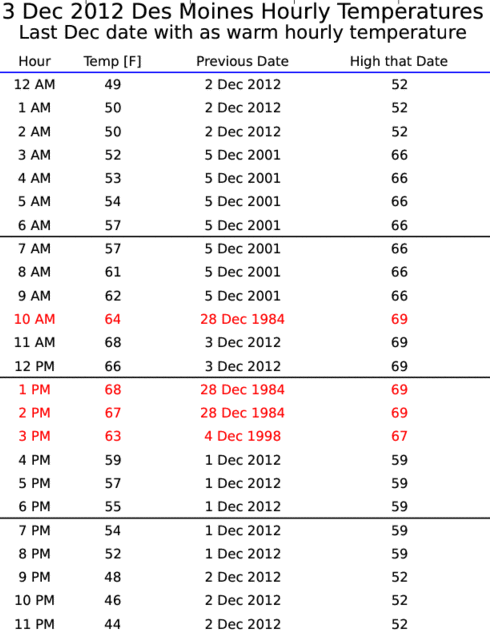
04 Dec 2012 05:46 AMMonday was yet another record warm day in Iowa and either tied or set the record warmest temperature for the month of December. The featured chart presents the hourly temperatures for Des Moines yesterday along with the date of the previously as warm temperature for that hour. The 11 AM and noon temperatures were the warmest on record for December. The overall high temperature was 69 degrees and tied the record for Des Moines. The reality of winter slowly works back into the forecast with highs next week expected to be much cooler.
Voting:
Good: 42
Bad: 2
Tags: 2012

Deficits
16 Nov 2012 05:50 AMThe featured chart displays the precipitation departures over three trailing time windows. The 30 days departures have recently turned positive for the first time since May, but dry conditions for the past few days have reverted us back toward zero. Deficits are much larger on longer time scales and we are eight inches short of average for the past 365 days. It will be difficult to make up the longer term deficit during the cold months of the year as the total precipitation is much less than the warm months. It will take heavy rainfalls in March and April to give us a chance to have recovered soil moisture prior to the growing season next year.
Voting:
Good: 61
Bad: 11
Tags: 2012

Hot November Saturday
13 Nov 2012 05:43 AMWith the current taste of winter fresh in our mouths, it seems a long time ago that temperatures soared to record levels on Saturday. Not only was it warm, it was some of the warmest weather we have seen in November on record. The featured chart presents the hourly temperature observations at the Des Moines Airport along with the most recent date with such warm weather for that hour in November. For a few of the hours, one has to go all the way back to the 1930s for warmer weather! The immediate term forecast keeps temperatures reasonable for this time of year with mostly dry conditions.
Voting:
Good: 29
Bad: 5
Tags: november 2012
Plenty of days over 63 to 83
24 Oct 2012 05:47 AMThe featured chart presents the number of days this year that Des Moines high temperature has been at or above a given threshold. For thresholds between 63 and 83, this year has seen the most number of days at or above those levels. Today will be yet another very warm day with highs expected to near 80 degrees. Big changes arrive on Thursday with highs back into the 40s for the weekend.
Voting:
Good: 19
Bad: 6
Tags: 2012

Late for 65 degree dewpoint
23 Oct 2012 05:51 AMVery muggy air for this time of year visited Iowa on Monday. The dew point temperature reached 65 degrees Fahrenheit for Des Moines. It is very late in the year to have such a high dew point temperature as shown by the featured chart. Only two other years (1934, 2004) have experienced 65+ dewpoint after 22 October. Two more very warm days are expected before much colder air arrives and highs will only be in the 40s!
Voting:
Good: 19
Bad: 6
Tags: 2012 2004 1934

Yet another day over 80
22 Oct 2012 05:49 AMAfter some blustery and chilly days this October, very warm weather returned on Sunday with the high temperature, once again, exceeding 80 degrees for Des Moines. Des Moines has already recorded the most number of days over 80 in any year for the site. The featured chart looks at the local day temperature departure for days this year that have been over 80. The very anomalously warm days in March were certainly the most exceptional of the year. The bottom chart shows the percentage of days over 80 that were also 10+ degrees warmer than long term average. 2012 shows up again with its contemporaries of 1934 and 1936.
Voting:
Good: 16
Bad: 4
Tags: 80 2012
Precipitation accumulation
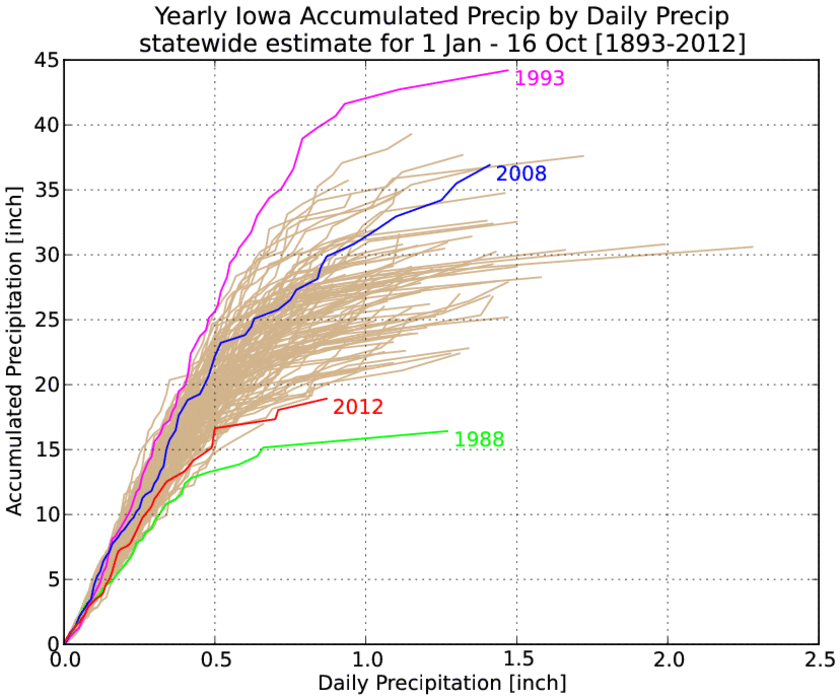
17 Oct 2012 05:41 AMPrecipitation comes in various forms and at various rates for Iowa. For this year, precipitation has been difficult to come by. Have we missed out on heavy rainfall events or lots of smaller rainfall events? The featured graph attempts to address this question by showing the accumulated precipitation over increasing daily precipitation. For example during 2012, the total rainfall for daily events less than 0.5 inch has been 15 inches. Restating, 15 inches of rainfall this year has come from daily events of less than 0.5 inches. The flood year of 1993 certainly sticks out on the opposite end of the spectrum. So for 2012, the line would indicate we have missed out on both light and heavy rainfall events.
Voting:
Good: 14
Bad: 5
Tags: 2012 1988 1993

Early for 12 degrees
08 Oct 2012 05:44 AMAfter spending most of the year comparing this year to the 1930s for hot temperatures, we now have a comparison for cold temperatures as well! At least two locations in Western Iowa reported a low temperature of 12 degrees on Sunday morning. This is the coldest temperature reported this early since 6 October 1935 when 12 degrees was reported as well. The featured chart presents the yearly minimum fall temperature reported prior to 8 October and the first date that a sub 13 degree temperature was reported for the fall for anywhere in the state. Typically, this cold of weather arrives in November.
Voting:
Good: 16
Bad: 3
Tags: 2012

When did the drought start?
05 Oct 2012 05:45 AMIowa remains in the firm grasp of a drought, but when did it start? It is hard to define when a drought starts as the term "drought" is ambiguous and it takes some amount of time of dry weather before the term can apply. The featured chart looks at the running departure of statewide precipitation over three different windows of time for a period around 1988 and our current drought period of 2012. For this year, this analysis would clearly indicate that significant deficits started showing up in May. Although, a closer look shows somewhat drier conditions existing since September of 2011. Let us compare 2012 with 1988 shown in the top chart. Significant deficits started appearing in March of 1988. If the 2012 drought started in May and 1988 in March, this may provide some insight into why agricultural crops were not a complete failure in the state this year. The reason being there was some soil moisture available to start off the growing season and some precipitation came in late August/September to help out. Notice how the 365 day departure degraded in Aug/Sep for 1988 and flattened out for 2012.
Voting:
Good: 43
Bad: 27
Tags: drought 2012 1988

Third driest
02 Oct 2012 07:18 AMFor the first nine months of the year and based on preliminary estimates by the IEM, 2012 comes in as the third driest on record since 1893 for Iowa. The featured chart displays the yearly totals of precipitation for the first nine months of the year. Only 1988 and 1894 come in with lower totals than this year. We really need a wet fall and winter season to recover the soil moisture in time for the planting season next year.
Voting:
Good: 23
Bad: 4
Tags: 2012

Most 80+ degree days
26 Sep 2012 05:43 AMTuesday was yet another very warm day in Iowa this year. The high temperature hit 85 degrees in Des Moines and set the local record for most number of days at or above 80 degrees in a year. The featured chart presents the maximum number of days per year at or above the given threshold. 2012 is on pace to rewrite this metric for temperatures in the 70s and 80s. Days in the 70s and 80s remain in the immediate term forecast along with dry weather.
Voting:
Good: 31
Bad: 6
Tags: 2012

Improving chances
20 Sep 2012 05:43 AMThis chart has been featured a number of times this summer season as it shows the chances that this year will become the warmest on record for Des Moines. The bottom charts shows that while we faltered some with some cool weather in August, the warm weather in September has boosted us back up to the best chances yet that this year will beat 1931 (the current warmest). The brown spaghetti lines represent all previous years appended onto this year until the end of the year and so represents scenarios if we have any reasonable repeat of previous years. Using these scenarios, 86% of previous years appended onto this one would result in 2012 being the warmest on record. These lines would also suggest that 2012 will remain warmer than 1931 until at least the first week of December.
Voting:
Good: 26
Bad: 5
Tags: 2012
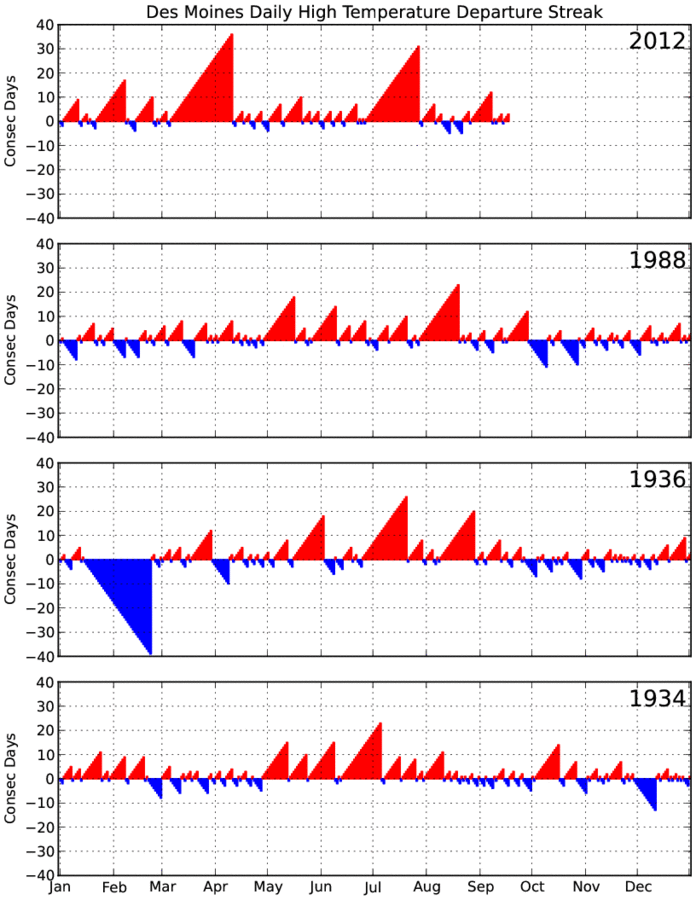
Shark fins
18 Sep 2012 05:45 AMMonday was one of the rare occasions this year to have a high temperature below normal, which started a streak of one day in a row below normal! The featured chart presents the streaks of above or below (negative numbers) daily high temperatures for Des Moines. This year is presented along with 3 famously warm years of the past. This year has yet to see a streak over 10 days below normal, whereas each of the other years shown have seen at least one. The longest of these streaks below average tend to occur in the winter time with significant snow cover. Our current streak looks to end on Wednesday with highs back near 80.
Voting:
Good: 40
Bad: 11
Tags: 2012

Days above X
12 Sep 2012 05:17 AMTuesday was yet another very warm day in Iowa with highs pushing 90 degrees for much of the state. For Des Moines, Tuesday tied the previous record for most days with high temperature at or above 82 and 83 degrees. The featured chart presents the maximum number of days per year at or above a given temperature threshold. The current maximum number of days is shown in gold and the 2012 total so far is shown in cardinal (Go Cyclones!). High temperatures today will come close to breaking the tie at the 82 and 83 thresholds. Keep in mind that we still have 3.5 months left to potentially break some of these other thresholds.
Voting:
Good: 38
Bad: 9
Tags: highs 2012

Year to date warnings
07 Sep 2012 05:40 AMOur recent weather has seen a stormy change when compared with the drought filled summer. One reflection of this is shown by the featured chart of accumulated severe thunderstorm and tornado warnings for each of the past five years. The top chart shows the nationwide accumulation while the bottom chart is for warnings issued by the NWS offices with Iowa coverage (includes some warnings slightly outside of Iowa). A logical correlation with drought conditions is the lack of heavy rainfall associated with severe thunderstorms. After being ahead of each year in late May for Iowa (purple line), the lack of many summertime storms now has 2012 as being the least of the past five years in early September.
Voting:
Good: 115
Bad: 17
Tags: nws 2012

100 degree heat index in September!
05 Sep 2012 05:24 AMTuesday was yet another very warm day this year and humidity came along for the ride this time pushing heat indices over 100 for much of Iowa. This is somewhat rare to occur in September with the last occurrence for Des Moines being back in the year 2000. The featured map is a simple analysis of computed heat indices from the primary automated weather stations in the state. All of this heat and humidity helped to fire numerous rounds of severe thunderstorms over night and into this morning.
Voting:
Good: 38
Bad: 8
Tags: 2012

Warmest summer since 1988
03 Sep 2012 05:41 AMWhile Labor Day is the unofficial end of summer, the end of August is the official end of meteorological summer (the months of June, July, and August). The average temperature this year was the warmest since 1988, but only slightly warmer than last year. The featured chart presents the average summer temperature for Iowa for each year since 1893. September has gotten off to a rather warm start with highs in the 90s for most in the state.
Voting:
Good: 26
Bad: 8
Tags: 2012 summer

50 days over 90
24 Aug 2012 12:02 AMThursday was yet another warm day for Iowa and Des Moines had its 50th day with a high temperature at or above 90 degrees. This makes for the largest total of days since 1988 as shown by the featured image. Only five other years than 2012 have had 50+ days over 90 degrees and we still have just over four months to go this year! The bottom chart presents the number of days each year above 90 for days after 23 August. We would need another 10 days to catch 1983 and then a bunch more to catch 1934 and 1936. The forecast has a high very close to 90 on Friday and then more close to 90 weather next week, so we are saying that we have a chance...
Voting:
Good: 112
Bad: 16
Tags: 90 2012

Dew Point Depression
23 Aug 2012 03:31 AMThe difference in dew point temperature from the air temperature is called the dew point depression. On Wednesday, the dew point depressions in Iowa were over 50 degrees Fahrenheit for some locations with a air temperature in the 90s and dew point in the 40s. For Iowa, this is a very rare event! The featured chart presents the largest dew point depression by year and the minimum dew point observed with an air temperature at or above 95 for Des Moines. The bottom chart shows that having such a low dew point and high temperature is very rare and last happened in 1955 (red bars). The upper chart shows that having a 50+ degree spread has happened in a number of past years, but for August it last happened in 1936 (not shown)!
Voting:
Good: 21
Bad: 7
Tags: 2012 dewpoint

Low dew points for August
21 Aug 2012 12:06 AMThe mostly dry conditions and lack of robust vegetation have lead to very dry conditions for this time of year. Dew points have accordingly been running very low this month. The featured chart presents the maximum and minimum dew point for the first 19 days of August for each of the past years since 1933 for Des Moines. Both values this year are some of the lowest on record and the lowest they have been in quite some time. The red bars are years at or lower than 2012. In order for the first freeze to occur, the dew point has to drop to freezing temperature as well. Could the low dew points be a harbinger of things to come, namely an early freeze?
Voting:
Good: 50
Bad: 11
Tags: 2012 dewpoint aug

Bad year for corn
17 Aug 2012 05:47 AMThe featured chart presents yearly time series of USDA reported weekly corn crop condition for Iowa and five nearby states. The charted line represents the total area estimated to be in either "poor" or "very poor" condition. These are the two worst categories that are designated. Each chart contains the time series for each year since 1986. Conveniently, this allows us to compare this year with the last major drought of 1988 in the Midwest. Other significant years of 2005 and 1993 are included for comparison. While 2012 has been devastating in Missouri, Illinois, and Indiana, things have not been all that bad in Minnesota. Compare that with what happened in 1993 where Minnesota got the worst of it. It is not for certain how much some recent rains in the Midwest will help the corn crop as the damage has pretty much already been done in the hardest hit areas.
Voting:
Good: 82
Bad: 25
Tags: usda corn 2012 1988 1993
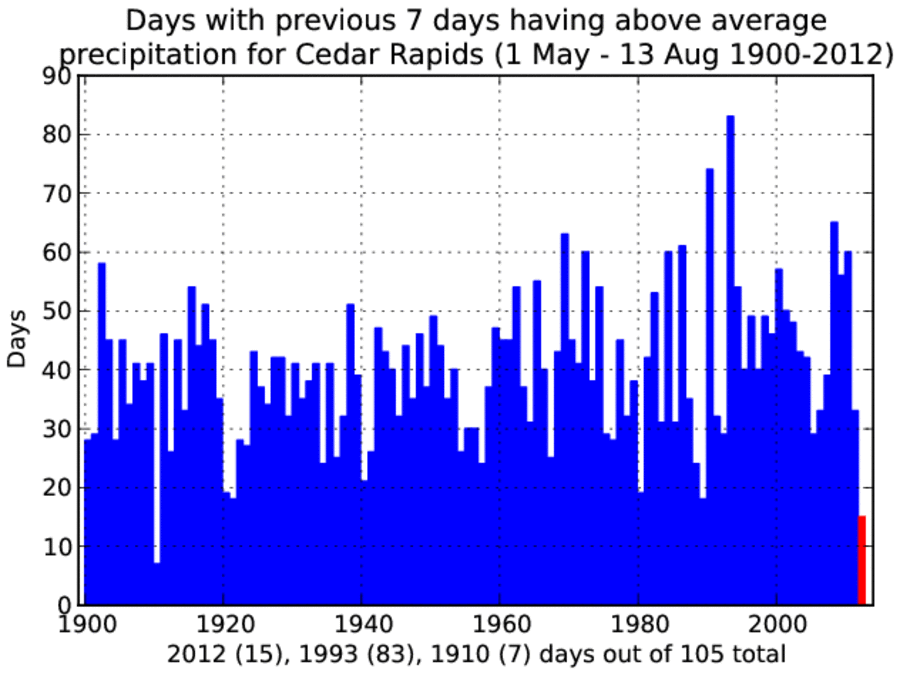
Wet weeks
14 Aug 2012 05:50 AMSustained rainfall has been very difficult to come by for this growing season. Even getting a seven day period with above average rainfall has been rare for most places in the state and especially the southeastern quarter of Iowa. The featured chart presents the number of days each growing season to date that the previous seven days (inclusive) of precipitation was above average for Cedar Rapids. For this metric, this year has the second lowest total since 1900. The next seven days look to be on the dry side of average as well with only modest chances of rain.
Voting:
Good: 63
Bad: 8
Tags: 2012

Comparing with 1988
11 Aug 2012 06:14 AMThe drought of 2012 for Iowa will certainly go down as one of the more extreme on record. Since most people can remember the drought of 1988, comparisons continue to be made to that year with many wondering which year was more severe. While there is no correct answer, the featured chart provides two metrics for comparison. The x-axis presents the accumulated, from 10 August back to the given date, precipitation departure for both this year and 1988. For the period since 1 January, 1988 had the least amount of precipitation since 1893. The two lines show that 1988's drought started much earlier in the year than 2012, but the intensity of the drought during the growing season has been slightly worse (for this period) in 2012. The chart also shows you how much precipitation we would need to erase a given deficit over some period. For example, at least ~8 inches are needed in order to erase the deficit since 1 May.
Voting:
Good: 137
Bad: 21
Tags: 2012 1988

2012 Humidity
09 Aug 2012 04:58 AMWhile much needed rain showers have recently graced much of Iowa, most of this summer has been very dry. The lack of rainfall produces water availability stress in plants and their production of water vapor by transpiration is decreased. The result should show up in decreased air humidities as shown by the featured chart of Des Moines daily mean mixing ratio (the amount of water in the air versus total air). In general, this has been the case for most of the summer with humidity values running near or below long term average. The warm and humid weather we had in March is probably the most noticeable feature in this chart. The initial wet period we had to start May also shows up as an elevated period of higher humidities.
Voting:
Good: 73
Bad: 15
Tags: 2012 mixingratio

A good bet
08 Aug 2012 05:24 AMTuesday was yet another very warm day this year with high temperatures reaching the century mark for some in the state. This year continues to be much warmer than any previous year on record for Des Moines. The featured chart looks at the possibilities that this year will end up being the warmest on record. The spaghetti of lines represents the combination of this year's data and all previous year's data from today to the end of the year. With these scenarios, 81% of the previous year's data would provide this year with the warmest year on record. A few weeks ago, this same chart was featured and the percentage was only 64%. The chart would indicate that this year will be the warmest on record at least until Thanksgiving.
Voting:
Good: 71
Bad: 12
Tags: 2012
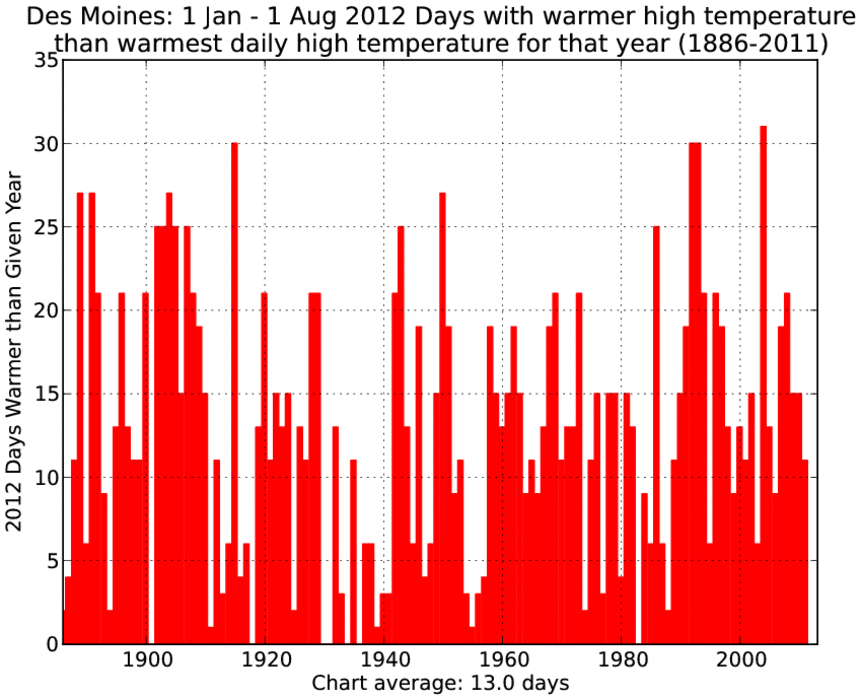
Plenty of Hot Days
02 Aug 2012 05:43 AMOn Wednesday, August started off where July left off as temperatures soared into the upper 90s. This year has seen more than its fair share of hot days. The featured chart presents the number of days during 2012 that were warmer than even the warmest day of a given previous year. For example, there have been 31 days this year in Des Moines that were warmer than the warmest temperature for all of 2004! The overall chart average is 13 days, which is remarkable. The hot weather looks to continue with another wave of really hot temperatures arriving next week.
Voting:
Good: 57
Bad: 10
Tags: 2012

Arbitrary Metrics
31 Jul 2012 05:43 AMThis feature continues the series of comparing how the drought this growing season stacks up with previous years. For this metric, an estimated areal coverage of Iowa is presented that had a previous thirty day period with less than two inches of total rainfall received. This arbitrary metric attempts to show the breadth of dry continues and how it changed over the period. The top chart presents the daily coverage for this year and four previous years of note. In this comparison, 2012 shows up much worse than 1988 in late July, but better in late June. The middle chart presents the simple average of the value over the June and July period and 2012 has the highest value around 60% since the year 1900 followed closely by 1988. The bottom chart looks at this value during a key period for corn development in mid-July. 1936 is easily the largest average coverage as shown by this metric. So the question remains unresolved, how does this year compare with previous drought years? Is it worse than 1988?
Voting:
Good: 53
Bad: 14
Tags: 2012 1955 1934 1936 1988
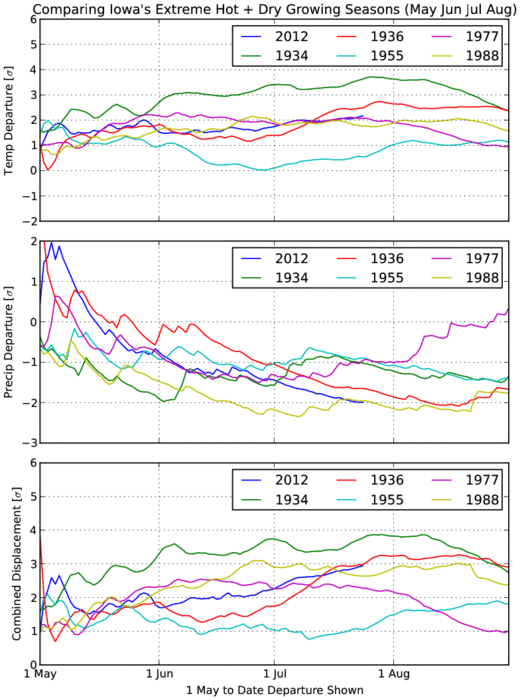
Comparing Years
26 Jul 2012 05:47 AMA common question asked this summer is how does this year compare with previous drought years, like 1988. While there is no easy nor correct answer to this question, we can certainly try different methods. The featured chart presents three time series of accumulated temperature and precipitation departures for the May through August time period. The year 2012 compares closely with 1988 at the current date of the year, but will it finish in a similar fashion? The current date precipitation departures from 1 May are some of the worst on record, so is this year worse than the epic years of 1934 or 1936? The temperature departure in the top chart has 1934 and 1936 with substantial leads over 2012. 1977 is thrown in as it was a significant drought for some in the state, is it worse than 2012? The bottom chart presents the distance from a zero temperature and precipitation departure, again there is no clear cut answer.
Voting:
Good: 76
Bad: 10
Tags: 2012 1955 1934 1936 1977

Extreme Company
23 Jul 2012 05:56 AMOur extremely warm and dry summer continued to roll along this past weekend with mostly dry continues and high temperatures topping 100 degrees for some locations in the state. Just how extreme has this growing season been? The featured chart presents the combination of statewide precipitation departure along with average temperature departure since the first of May. The unit of measure is sigma (one standard deviation from average). This convention allows a somewhat equitable comparison between temperature and precipitation departures. The circle on the chart represents an equidistant line that passes through 2012. Only four other years show up as more extreme than this year and they are all well known to Iowa's climate history.
Voting:
Good: 96
Bad: 8
Tags: 2012

Chances of beating 1931
20 Jul 2012 06:57 AMThe exceptional warmth of 2012 has certainly continued during July. Even with northerly winds on Thursday, temperatures were still able to reach the 90s for most of the state. What are the chances that this year will be the warmest on record? The featured chart presents the combination of the current year-to-date average temperature along with the rest of each year previously back to 1880 for Des Moines as a potential scenario. This year could certainly continue to be unlike any other previous year, but for the sake of argument we will assume it repeats like some previous year. With these scenarios, 64% of the previous years would help us to finish as the warmest year on record. So while the current year-to-date lead is very large, there is time to lose ground. This chart would also indicate that this year should remain warmer than the warmest on record until mid November at the earliest.
Voting:
Good: 222
Bad: 38
Tags: 2012

Lack of overnight rainfall
17 Jul 2012 05:47 AMIn the summertime, overnight thunderstorms provide a majority of the total rainfall in Iowa. The featured chart presents the hourly total rainfall for this year and the climatological value for the past 70 years or so. There has not been much rainfall during the midnight to 8 AM period. This rainfall typically comes from thunderstorm complexes that develop over Nebraska and South Dakota in the late evening and roll into Iowa overnight dumping heavy rainfall over wide areas. Instead, most of our rainfall this summer has come from mid-afternoon thundershowers that have been hit or miss for many in the state. If there is any good news, it is that some areas have seen some much needed rain, but much more is needed to save the corn crop.
Voting:
Good: 86
Bad: 12
Tags: 2012

Exceptional Year
16 Jul 2012 05:47 AMThe featured chart displays year to date values of average temperature for each year since 1880 for Des Moines. The red line is the year to date for 2012 and you can see that it is well above any of the previous years since the middle of March. The black line is climatology and the purple line is for the warmest year, 1931. As a thought experiment, the blue line represents this year but with the data for March swapped out for average values. So the blue line is what this year would have been like if we had an 'average' March. You may recall, temperatures in March absolutely destroyed any previous average temperature records for the month.
Voting:
Good: 469
Bad: 8
Tags: 2012

Drought covers the state
13 Jul 2012 06:18 AMThe US Drought Monitor is updated weekly providing an analysis of drought conditions for the country. This week's update has the entire state covered by at least abnormal drought conditions. The featured graph shows the areal coverage of drought conditions over Iowa. The worst conditions are analyzed at "D2 Severe" level over east central Iowa.
Voting:
Good: 234
Bad: 30
Tags: 2012

Hot Three Days
07 Jul 2012 05:58 AMThe high temperature reached the century mark at Des Moines for the third straight day on Friday. The featured chart presents the warmest three day period (in terms of average high temperature) each year since 1880. The last year to have a three day period average over 100 degrees was 1988. The two warmest years in this chart were during the 1930s (1934 and 1936). The good news is the oppressive heat is being pushed out of the state on Saturday and highs are expected back in the 80s next week.
Voting:
Good: 66
Bad: 10
Tags: 2012 highs

100 degree reports
04 Jul 2012 06:14 AMThe featured map presents a simple display of the location of 100+ degree daily high temperature reports from the NWS COOP network. While these reports have been common over Missouri, Kansas, and Nebraska, they have struggled to cross the border into Iowa. You can even notice roughly the same effect in northern Illinois. What would make this area unique? Certainly the intensive cropping along with some timely rains have helped to keep conditions a bit more humid here, which makes it harder to warm in the mid afternoon. Iowa could certainly start to see its share of 100 degree weather if the rains stop and this hot weather pattern continues.
Voting:
Good: 68
Bad: 16
Tags: 2012

Still #1
02 Jul 2012 05:48 AMJune is now in the books and this year still ranks as the warmest on record for most sites in the state. The featured chart shows the year to date ranking and departure from warmest for Ames. We took the lead in mid-March and have not looked back. Given that the lead is so large and this next week looks to be blisteringly warm, we should stay as the warmest year on record well into September (for worst case with theoretical record cold July and August weather). The most realistic chance to lose the warmest year on record would be for a cool fall and cold November and December.
Voting:
Good: 65
Bad: 13
Tags: 2012

Drought coverage
08 Jun 2012 05:35 AMThe United States Drought Monitor is an analysis of current drought impacts put together by a team of scientists. Thanks to a mostly dry May and a dry start to June, the situation in Iowa is rapidly deteriorating. The featured chart shows the history of drought designation coverage in the state since the start of 2011. Unlike last year, where there was near no drought to start the beginning of the growing season, this year is going into summer with dry conditions covering most of the state. The prospects for heavy rainfall continue to not look very good.
Voting:
Good: 205
Bad: 35
Tags: 2012

Dry summer in store?
05 Jun 2012 05:48 AMOur recent stretch of weather has been on the dry side for most in the state. The month of May and spring season was below average as well for most. Is a dry summer season in store for us this year? The featured chart compares the spring season and May total precipitation against the resulting summer season precipitation. Any year above the blue line would have been above average for the combined period. The red line shows this year's total for comparison with other years. The good news is that our odds do not appear to be too small to get a wet summer season by these two metrics. The bad news is that the near term forecast is not that encouraging for heavy rainfall events.
Voting:
Good: 20
Bad: 3
Tags: 2012

Record Spring
04 Jun 2012 05:52 AMThe meteorological spring season (March, April, May) is complete and for average temperatures it was easily the warmest on record. The featured chart presents the spring season average high, high+low, and low temperature for each year since 1893 for Iowa. 2012 was not only the warmest year on record for this period, but by a rather large margin. This was thanks to the epic warmth in March. Our recent stretch of weather has seen its share of cooler than average days and the forecast for this week has us in the upper 70s and lower 80s for high temperatures.
Voting:
Good: 29
Bad: 3
Tags: spring 2012

Still in the lead
09 May 2012 05:52 AMThe featured chart presents the year to date rank and departure this year's average temperature for Ames compares with previous years. Since the end of March, we have been in first place and have not relinquished the spot yet. The forecast for the rest of this week keeps temperatures near average values and mostly dry.
Voting:
Good: 24
Bad: 5
Tags: 2012

Early for 70 degree dew points
08 May 2012 05:51 AMWarm and moist air surged into Iowa this past Saturday pushing dew point readings over 70 degrees Fahrenheit for Des Moines. The featured chart presents the period between the first and last 70 degree dew point each year. Saturday was only the 5th of May making for the earliest 70 degree reading since 1955!
Voting:
Good: 39
Bad: 5
Tags: dewpoint 2012

Record Pace of Warm Days
18 Apr 2012 05:54 AMYesterday was yet another day this year with the high temperature above average for the date, which made for the 84th day this year above average. The featured chart presents the day which was the 84th day above average for each year since 1900. For 1993, it took until the October to have this many above average days! For the past five years, this total was not reached until June! Just another way that this year has been exceptional.
Voting:
Good: 21
Bad: 4
Tags: 2012

Damaging Cold
12 Apr 2012 05:04 AMCold nights typical of this time of year have taken a toll on the vegetation in the state these past three days. The featured chart is of minimum reported temperature from the airport sites since our recent cold stretch began. Temperatures have dipped well below freezing over the entire state. Normally, this weather would not be of concern as our growing season would be starting a few weeks from now. The record warm winter and March got everything growing much earlier this year and put our vegetation in a very vulnerable position.
Voting:
Good: 21
Bad: 6
Tags: 2012

26 days and counting
05 Apr 2012 05:52 AMOur remarkable stretch of warm weather continues to set interesting records. The featured chart shows the daily high and low temperature departure from average for Des Moines since the first of March. The past 26 days have seen a high temperature ten or more degrees above average. This is easily the longest streak on record for the site and bests the previous longest streak of 17 days back in Jan-Feb of 1931. Much cooler overnight low temperatures are set to arrive this evening with chances of sub freezing temperatures over the northeastern half of the state.
Voting:
Good: 23
Bad: 5
Tags: 2012 highs

Warmest start to a year for Ames
29 Mar 2012 05:52 AMThe featured chart for yesterday showed this March easily being the warmest on record for Ames. Today's chart based on preliminary data shows the current year to date being the warmest on record as well for Ames. The warmth will roll on with temperatures returning to the 80s this weekend.
Voting:
Good: 19
Bad: 6
Tags: 2012

Warm start for the year
23 Mar 2012 05:58 AMThis year has started off being one of the warmest on record. The featured chart presents two computed metrics of accumulated growing degree days and simple average temperature. While the average temperature ranks a close second for Ames, the accumulated growing degree days blow away the competition. It is little wonder that plants are getting going early this year, but the major concern is that there is plenty of time for a hard freeze.
Voting:
Good: 47
Bad: 13
Tags: 2012

Going to feel like May
13 Mar 2012 05:51 AMOur next week of weather looks to be nothing short of amazing with high temperatures well into the 70s! This continues the trend of having well above normal temperatures so far this year. The featured chart presents the date on which the reported daily high temperature nearly equals climatology. So having a high temperature in the lower 70s today would feel like average in early May. The colder than average days (the very few that there are) so far this year are shown as well. Some days were colder than the yearly minimum high temperature and are simply drawn to 1 Jan.
Voting:
Good: 22
Bad: 2
Tags: 2012
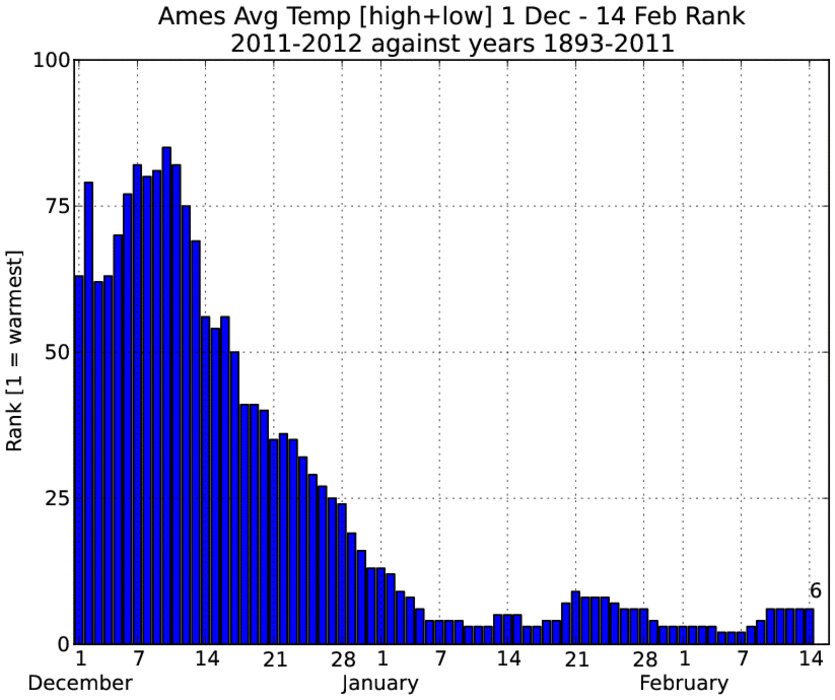
6th warmest
15 Feb 2012 05:51 AMThe featured chart presents our winter to date rank for average temperature for Ames. We had gotten to 2nd warmest only to fall back to 6th place after our recent stretch of more winter like weather. The forecast does not look to better our ranking, but temperatures are expected comfortably above freezing each day. Only two more weeks to go until we are out of meteorological winter!
Voting:
Good: 12
Bad: 3
Tags: 2012

Minimal Winter
08 Feb 2012 05:54 AMThe featured chart is another illustration of how warm this winter has been. The chart shows the number of days this winter season that the low temperature has been at or below a given temperature threshold. The blue line represents the minimum total for any year prior to this year. The teal line is this winter and it closely hugs or exceeds the previous minimum at some thresholds. The overall minimum temperature has only been 1 degree this year, which would be the warmest on record if it stands for the rest of winter. Our last winter is plotted in red and shows how much different it was than this year.
Voting:
Good: 14
Bad: 3
Tags: 2012

Three days of 60+
02 Feb 2012 05:49 AMWednesday was yet another amazingly warm day in winter for most folks in Iowa. Des Moines hit 60 degrees for the third day in a row. The weather bureau noted that this was the first three day stretch of 60 degrees for Des Moines during the period of 15 Dec to 15 Feb on record! The featured chart presents the warmest three day streak of weather based on the minimum high temperature during that period. The first day of the streak is used to place the three day value for a month. Our most recent streak would be the warmest for January besting the previous streak in 2002 of 59.
Voting:
Good: 11
Bad: 4
Tags: 2012 highs

Yet to see zero
27 Jan 2012 05:56 AMMinneapolis was featured last week for tying the latest date into the winter season it has gone before hitting a zero degree or lower temperature. The featured image looks at the minimum temperature to date for Des Moines. This year is with a handful of others to not see a sub zero temperature by this date. The warmest minimum temperature for the entire winter was zero for 1930-1931, so there is a chance we could best that mark this year. There is plenty of winter to go yet.
Voting:
Good: 15
Bad: 2
Tags: 2012

Warm winter so far
20 Jan 2012 05:55 AMThe featured chart presents the percentage of days this winter (since 1 Dec) has been warmer than previous winters. Each day this winter is compared with the same day of the year for previous winters. The bars shown in blue are years with more days colder that winter than this one. So we have another plot showing how warm this winter has been so far, but our weather pattern has changed and normal winter has returned to Iowa. Snow will fall today and there is more snow in the forecast!
Voting:
Good: 16
Bad: 4
Tags: 2012

Been warm up north too
19 Jan 2012 05:39 AMThe featured chart presents the minimum temperature each winter for Minneapolis up until 18 January. If Minneapolis would have stayed above zero Fahrenheit on Wednesday, it would have been the latest date into the winter they have gone without a sub zero temperature. A strong cold front plowing through late last night and dropped the temperature to -1 just before midnight! "Missed it by that much!" Anyway, full blown winter has returned and today's weather certainly makes it feel like what the calendar indicates: the middle of winter!
Voting:
Good: 17
Bad: 2
Tags: 2012

Not much cold to speak of
11 Jan 2012 05:50 AMAfter yet another very warm day for January, the featured chart presents another metric showing how warm this winter has been so far. This time the number of hours with a wind chill reading below 0 Fahrenheit for Des Moines is presenting showing this year's total only slightly ahead of 1954 and 2002 since 1933. The situation is about to change with colder air arriving and windy conditions for the next few days. The extended forecast does look to be warmer again next week.
Voting:
Good: 28
Bad: 3
Tags: 2012

Missing the cold of winter
10 Jan 2012 05:44 AMThe big story this winter continues to be the warmth and lack of snow. Even our coldest temperature reading so far this winter season is at record levels for most of the state as shown by the featured map. The featured map presents the percentile value for this winter season's minimum temperature compared against the same period for previous winters. Values of 100% would indicate that this winter has seen the warmest minimum temperature for the season so far. High temperatures today are expected to reach near daily record levels again!
Voting:
Good: 37
Bad: 2
Tags: 2012

Warm start to Winter
09 Jan 2012 05:48 AMThe meteorological winter season (1 Dec - 28 Feb) has started off being one of the warmer ones on record. Does a warm start to date of winter mean a colder end? The featured chart compares the average temperature for winter before and after 8 January. From this analyis, 2012 is the fifth warmest statewide since 1893. There is plenty of spread in the chart, so it is hard to say how bad the rest of our winter will be. The next week looks to be mostly on the warm side with a brief bout of near average temperatures.
Voting:
Good: 15
Bad: 5
Tags: 2012