Past IEM Features tagged: nws
View larger image
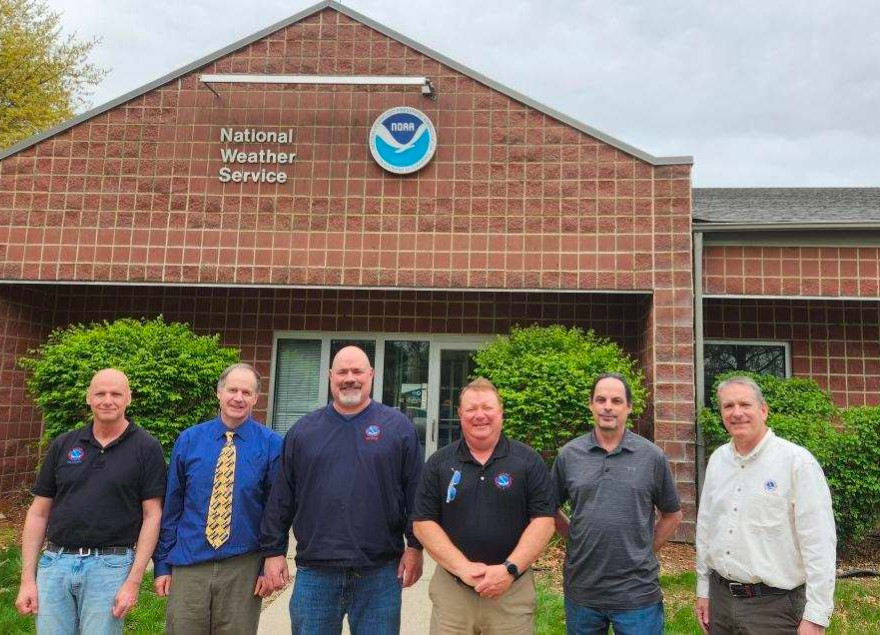
Left to right, Marvin Percha, Roger Vachalek, Craig Cogil, Shane Searcy, Darren Gregory, and Brad Small
Goodbye NWS Friends
02 May 2025 05:30 AMThis week was a bitter pill to swallow as a large number of National Weather Service employees took (early) retirement as a part of continued downsizing of the federal government. Scores of these employees the IEM (read myself) has interacted with over these past 25 years as we collaborated on datasets and tools to further our collective goals of supporting science, industry, and the public. The featured picture is of just those retiring from the Des Moines office. Roger, second from the left, was one of my idols growing up in Eastern Iowa and a big reason I got into Meteorology. Craig was an extremely avid IEM advocate, passionate about creating quality climate products, and provided invaluable feedback on IEM website tools in this space. Shane and Brad were on the team, with myself, that created the instant messaging system the NWS used to collaborate with partners (named IEMChat then NWSChat). An incredible amount of knowledge and expertise forecasting Iowa's weather is now gone. With about 25% of the total NWS workforce now gone nationwide and perhaps more cuts coming, the organization, services, and datasets of the NWS are under going major changes. Goodbye NWS Friends.
- daryl
Voting:
Good: 53
Bad: 0
Abstain: 2
Tags: nws

Date of Yearly Max Tornado Warnings
21 Nov 2023 05:30 AMSevere convective weather returned to the US on Monday with the NWS issuing a number of Tornado Warnings over the Louisiana and Mississippi area. Having significant outbreaks during the month of November is certainly not out of the ordinary as the transition month features the classic clashes of air masses over the southern US. The featured chart presents the unofficial IEM computed yearly date of maximum number of Tornado Warnings issued. Each bar is labelled with the date and the number of warnings issued for that date. The months are labelled at the bottom with the number of yearly maxes for that month. Only July is shown to have had no yearly maxes since 1986, which makes sense as the month has the least frequent aforementioned clashes of strongly contrasting air masses. The overall maximum is the outbreak of 27 April 2011 with a mind bending 463 Tornado Warnings.
Voting:
Good: 11
Bad: 0
Tags: tornado nws

Special Weather Statement Polygons
10 Nov 2023 05:30 AMWhen conditions are not quite to levels necessitating a warning or advisory, the National Weather Service has a sort of "catch-all" product called the Special Weather Statement (SPS). This product will be issued for one or more counties / forecast zones and can optionally include a polygon to target a more limited area. The featured map presents the number of such SPS products issued that contained a polygon so far this year. The map shows that a few offices don't issue SPS products with polygons. They are not required with the product. The IEM maintains an text archive of these and offers a shapefile download of the polygons with associated tags found within the text.
Voting:
Good: 12
Bad: 1
Abstain: 1
Tags: nws sps

Special Weather Statement Counts
10 Jan 2023 05:30 AMThe National Weather Service (NWS) issues a wide variety of text products with the goal of saving life and protecting property. Each product has a slightly different aim and is used in different situations. The Special Weather Statement (SPS) is a catch-all product to alert folks to weather that may be slightly below warning/advisory limits and/or used to cover about everything else under the sun. The IEM has a massive archive of NWS text products dating back to the mid 1980s. The NWS has changed a lot of procedures and policies over the years, but the text product format remains. So the featured chart presents the total number of SPS products issued by month and year for NWS Des Moines. Since the product usage has changed and the SPS itself has changed over the years, such a plot should be considered with a grain of salt. Of immediate interest is the heavier usage of this product during the early 1990s and general absence of usage during the mid 2000s. You can generate this product for other product types / offices via the "Generate this Chart on Website" link below.
Voting:
Good: 10
Bad: 0
Tags: nws

No Tornado Warnings since July
12 Nov 2020 05:35 AMThe warm side of the storm system on Tuesday prompted the issuance of a Tornado Watch that just clipped far eastern Iowa. The issued Tornado Warnings stayed just outside the state over Illinois. Iowa has not seen a Tornado Warning since late July as shown by the featured chart. Note that tornado warning counts do not equate to observed tornado counts as a number of tornadoes were reported during the 10 August Derecho. The left most plot displays the yearly accumulated number of warnings over the state based on unofficial IEM archives. Only one other year (1992) since 1986 is shown without a warning after 1 August. Of course, the year of 2020 is not over yet and the way things have gone, we'll see a tornado outbreak during December!
Voting:
Good: 14
Bad: 0
Tags: nws tornado

Saturday Storm Motion
31 Mar 2020 04:22 AMWhen the National Weather Service issues Tornado and Severe Thunderstorm Warnings, they include how fast and the direction of travel that the warned storm is taking. The featured chart presents this combination for Tornado Warnings issued by NWS Des Moines. Values for the severe storms this past Saturday are highlighted in red. The lines on the plot represent a kernel density estimate with the centroid located near 30 MPH from the west-southwest. This dominate storm motion reflects the prevailing westerly motion of the middle part of the troposphere, which generally guide storms for west to east. The preference for a more southwesterly component reflects a flow pattern that is more favorable for warm air transport from the Gulf of Mexico north and cooler air transport of Canadian air south. Tornado producing storms feed off these contrasts.
Voting:
Good: 10
Bad: 0
Tags: stormmotion nws warnings

Lots of Colors
10 Jan 2020 04:53 AMThe featured map is courtesy of the weather.gov NWS website and shows the currently active watch, warning, advisory, and other headlines. This map is affectionately known as the "WAWA" map. Weather enthusiasts often look at this map as an indication on how active the current weather situation is based on the variety and number of colors shown. The NWS has a specific color to represent each alert type. The IEM archives this map and makes it available for archive usage. The current map this Friday morning shows the active situation expected today and into the weekend with a powerful spring-like storm system bring severe weather, ice, and heavy snowfall to a considerable chunk of the country.
Voting:
Good: 16
Bad: 0
Tags: nws

Add SQ.W to the listing
11 Dec 2019 05:34 AMThe IEM attempts to curate a rigorous accounting of the watch, warnings, and advisories issued by the National Weather Service. The NWS Offices serving Iowa have a new alert type this winter season called the Snow Squall Warning. It is abbreviated as SQ.W in their text product alerts. NWS Davenport issued such an alert on Monday for the quick hitting snowfall that was causing travel difficulties. The featured chart presents a yearly accounting of the unique number of tracked alert types issued by NWS Davenport. The number of distinctly used Valid TIme Event Codes (VTEC) phenomena and significance values per year is shown by the top panel and the bottom panel explicitly lists them out. Note that there are other alert types not covered by this presentation. This is for only those that contain VTEC.
Voting:
Good: 9
Bad: 1
Tags: vtec nws

High Wind Warning
22 Oct 2019 05:34 AMThe NWS issued a High Wind Warning over much of northwestern Iowa overnight due to forecast winds gusting to 60+ MPH. This alert is one of the rarer ones issued by the NWS and the featured map presents the yearly frequency of such a warning by county. The favored area for this warning type is clearly shown over northwestern Iowa. This area is characterized by flat and mostly tree free ground on the Des Moines Lobe and Northwest Iowa Plains, which helps to reduce friction effects that will slow near surface wind speeds down. The area is also closer to preferred locations for rapidly deepening surface cyclones over the Great Plains and locations north of the state. Far southern and southeastern Iowa are more hilly and tree covered, both working to reduce wind speeds.
Voting:
Good: 15
Bad: 0
Tags: nws

Late for First Tornado Warning
22 May 2019 05:33 AMAdd another stat onto the pile showing the cold that has mostly plagued the state this spring season. The first Tornado Warning of the year was issued over Iowa early Monday evening as some impressive wind sheer worked into far southwestern Iowa. The featured chart depicts the period between the first and last Tornado Warning each year over Iowa based on unofficial archives maintained by the IEM. This year's first warning was the second latest into the year since 1986. The only year with a later date was 1993. Of course, 1993 was the epic flood year for the state.
Voting:
Good: 11
Bad: 0
Tags: warning nws

Low Warning Total
15 May 2019 05:32 AMBy mid-May, severe weather season is typically well underway for Iowa. This year has been a bit different with cool temperatures and limited amounts of surface moisture which both limit available instability for severe thunderstorms to thrive. The featured chart displays the year to date accumulated Tornado and Severe Thunderstorm Warnings for the state of Iowa since 2008. This year's total is the lowest shown by a considerable margin. The near term forecast has an increase in heat and humidity, so also an increasing chance of thunderstorms.
Voting:
Good: 11
Bad: 0
Abstain: 1
Tags: nws

Rare Storm Motion
22 Jun 2018 05:26 AMA pesky upper level low pressure system has been causing interesting weather these past few days. On Thursday, NWS Des Moines issued a number of Tornado Warnings for storms that were moving toward the northwest. Storms that move in that direction rarely get Tornado Warnings over Iowa. The featured chart displays a scatter plot and kernel density estimate for NWS Des Moines issued Tornado Warnings that include an analyzed storm motion. The red dots are from Wednesday's event and there is very little company for storms that have some westward moving component. The setup for storms moving in that direction to produce tornadoes is very rare in this part of the country. The chart shows the dominate storm motion of about 30 MPH from the WSW.
Voting:
Good: 13
Bad: 0
Tags: time...mot...loc warnings nws

Severe TStorm Warnings by Time of Day
29 Mar 2018 05:34 AMThis is Severe Weather Awareness Week in Iowa and Thursday's topic is family preparedness. Severe Thunderstorms are possible at any time of the day and at times when your family may not be home together. The point is to think about how your family receives warnings when not all together, takes action on those warnings, and advises each other of their status during and after the event. Along these lines, the featured chart presents the time of day frequency of Severe Thunderstorm Warnings issued by NWS Des Moines. While certainly there is a peak in frequency around 6-7 PM, the rest of the day are non-zero values meaning severe storms are possible during all hours of the day. Thankfully individual storm systems provide more narrowed threats in time and the vast majority of days in Iowa are severe storm free. These events are rare enough that it is important to raise awareness and review your action plans in early spring each year.
Voting:
Good: 11
Bad: 1
Tags: swaw nws warnings

Tornado Warning Polygons
28 Mar 2018 05:33 AMThis is Severe Weather Awareness Week in Iowa and Wednesday's topic is tornadoes. Tornadoes have been recorded in Iowa during each month of the year and about every hour of the day. The NWS issues Tornado Warning "Storm Based Warnings" in the form of geographic polygons. While the featured map may look like your grandmother's quilt, it is actually a map showing the last year a location in the state was under a Tornado Warning. The archive for these polygons goes back to 2002, but they were not the operational warning until late 2007. There are a number of interesting artifacts on the map including some slivers of the state that have not seen a polygon Tornado Warning since at least 2002. You can generate maps like these on this website for other states along with many other options too!
Voting:
Good: 15
Bad: 1
Tags: swaw nws tornado

NWS Warning Reception
27 Mar 2018 11:06 AMThis is Severe Weather Awareness Week in Iowa and Tuesday's topic is warning reception. There are many ways to receive alerts when the NWS issues a warning for your location. Relying on hearing a siren before taking action is problematic as sirens are meant to alert folks while outdoors and are single points of failure. Sirens also are not used to alert people to threats like flash floods. The NWS has provided a few links for your review
The IEM provides a number of non-operational / educational ways to receive NWS
Warnings. These include services provided by "IEMBot" such as RSS
feeeds, Twitter automated posts, and real-time web apps.
Voting:
Good: 4
Bad: 0
Tags: swaw nws
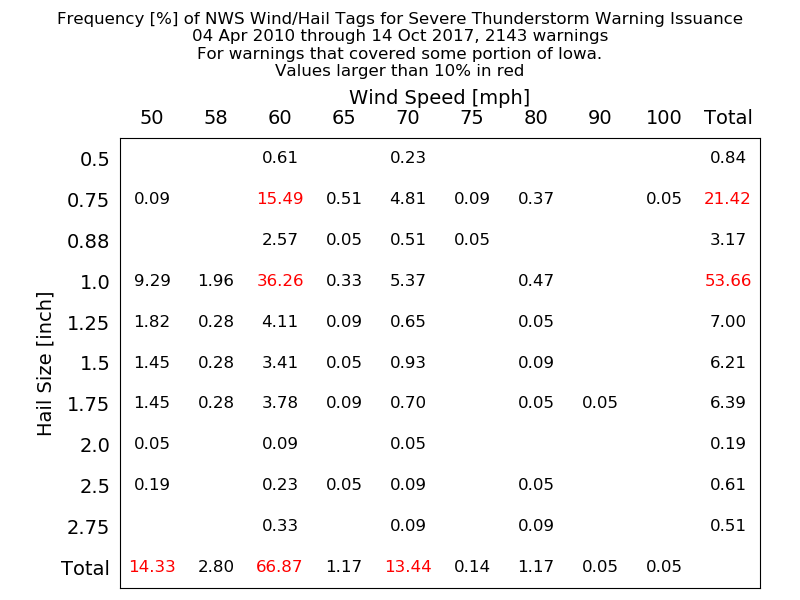
Severe Thunderstorm Threats
26 Mar 2018 08:57 PMThis week is Severe Weather Awareness Week with Monday focusing on severe thunderstorms. The National Weather Service issues a Severe Thunderstorm Warning when it expects damaging winds over 58+ MPH and/or hail larger than one inch diameter. When the NWS issues their warning, it includes coded "tags" indicating their estimated wind speed and/or hail size. The featured chart looks at the frequency of these tags within the warnings. The most common thunderstorm warning (over one in three) is for 60 MPH winds and one inch hail. Thankfully the frequencies drop off considerable has you move to more intense thresholds. Iowa has yet to see a Severe Thunderstorm Warning yet this year. The peak for these warnings comes in late June.
Voting:
Good: 11
Bad: 0
Tags: swaw ibw nws

Winter Headlines
31 Jan 2018 05:33 AMThe featured calendar displays the number of NWS issued winter weather headlines. For this context and plot, these are limited to a set of four common winter alerts (Winter Storm Warning, Blizzard Warning, Wind Chill Advisory, and Winter Weather Advisory). The calendar displays the number of events issued by all NWS offices, where an event is defined by a single product issuance over some area. For example, a single winter storm warning for 20 counties in Iowa issued by NWS Des Moines would count as one in this plot. The calendar shows that the winter season has been the most active since the end of December. You can generate this plot for your own period, alerts, and office of your choice on this website.
Voting:
Good: 5
Bad: 0
Tags: nws

6th Most Common
27 Dec 2017 06:52 AMThe NWS has the entire state under a Wind Chill Advisory this morning. As measured by the number of unique events by a forecast county/zone, this advisory is the sixth most commonly issued alert by the NWS Des Moines. The featured table presents the relative frequency of an alert as issued by NWS Des Moines against the most common alert, the Severe Thunderstorm Warning. The relative percent indicates in bulk that a severe thunderstorm event is twice as common as a wind chill advisory. The Wind Chill Warning has colder thresholds for alerting than the advisory and appropriately appears at much lower frequencies for the chart.
Voting:
Good: 8
Bad: 0
Tags: nws

Watches
11 May 2017 12:02 AMNWS Des Moines issued two watches yesterday, a Severe Thunderstorm Watch and a Flash Flood Watch. The eventual storms yesterday did yield a few Severe Thunderstorm Warnings over the watch area and even a few tornadoes further east within Davenport NWS's area, but no Flash Flood Warnings. The featured chart looks at some IEM computed metrics on the conversion of watches into warnings. The red bars represent the overall frequency of converting an individual watch event into a warning (meaning getting at least one warning anywhere within the watch). The blue bars represent the individual county/zone conversion of a watch into a warning. For example, there is a 59% chance of getting at least one warning within the Flash Flood Watch yesterday and 19% frequency of an individual county within the watch getting one warning. The moral of this story is that not all watches are created equal. The actual size of the event the watch is for creates large differences in the frequencies. One item to note is that this plot is for a straight conversion and does not consider the situation of the eventual warning being of a different type. For example, some Winter Storm Watches become Blizzard Warnings.
Voting:
Good: 5
Bad: 0
Tags: nws watch
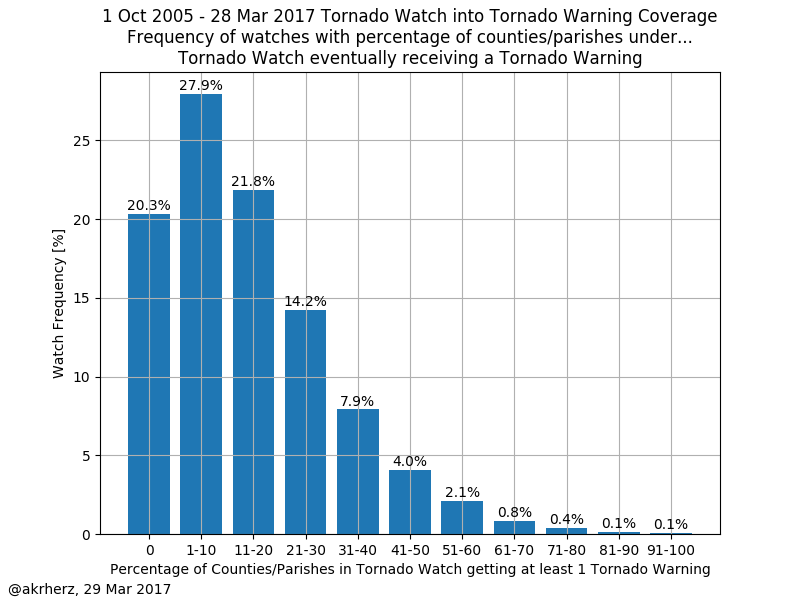
Tornado Watches into Warnings
30 Mar 2017 05:33 AMContinuing with the theme of Severe Weather Awareness Week in Iowa this week, yesterday was the statewide tornado drill with a test watch and warning issued for the entire state. Today's featured chart looks at the conversion of counties under a tornado watch into a tornado warning. For example, if a tornado watch was issued for 60 counties and 30 of those counties received a tornado warning, that would count with the 50% bin for the plot. About 20% of all tornado watches receive no subsequent warning. Most watches have less than 30% of the counties included eventually get a warning. Thankfully, tornadoes typically are not widespread and limited to a couple of high end storms during a typical watch. Hopefully that is the case today with a significant tornado threat expected over the southern US.
Voting:
Good: 7
Bad: 0
Abstain: 1
Tags: nws spc tornado watch

SPC Watch Issuance Confidence
29 Mar 2017 05:36 AMContinuing with the theme of this week being Severe Weather Awareness Week in Iowa, today's featured plot looks at an analysis of convective watch issuance verification based on probabilities included in Mesoscale Convective Discussions (MCD) issued by the Storm Prediction Center (SPC). The SPC issues the MCD product to provide a short term update and analysis of the storm scale environment during active weather. Prior to most tornado or severe thunderstorm watch issuance, the SPC typically issues a MCD to highlight an area of interest and provides a confidence percentage on if a new watch may be soon issued. The association of an issued watch and the MCD product is not exact, so a simple algorithm was used with reasonable defaults to provide a verification of these percentages. The algorithm being the new watch needed to be issued with 2.5 hours and at least 50% of the watch polygon had to overlap with the MCD polygon. What is the moral of the story? Well, the high confidence MCDs typically get an issued watch, the lower confidence ones typically do not. The next time you read a MCD product from the SPC, check out the confidence noted and see if a subsequent watch is issued!
Voting:
Good: 6
Bad: 0
Tags: nws spc mcd watcfh

NWS Local Storm Reports
28 Feb 2017 05:39 AMThe National Weather Service collects weather reports from their partners and the general public. These reports are then relayed to the world in the form of a text product named Local Storm Reports (LSR)s. The IEM processes and archives these reports to then make them available for download. The featured map displays the number of LSRs by NWS Forecast Office so far this year. Only reports of hail, tornadoes, and severe thunderstorm wind gusts and damage are shown. Significant amounts of severe weather are anticipated today and tomorrow, so areas in the central US that haven't seen much activity yet this year are expected to with this event.
Voting:
Good: 6
Bad: 1
Tags: nws lsr

November Tornado Warnings Again
29 Nov 2016 05:33 AMAn ideal setup for tornadoes in Iowa during November materialized on Monday prompting the NWS Des Moines to issue seven tornado warnings. This makes for the second year in a row that November received the most number of warnings by the office. The featured chart displays the monthly warnings count for NWS Des Moines since 1986. Previous to last year, one has to go back to the famous tornadoes back in 2005 for issued warnings in November.
Voting:
Good: 7
Bad: 0
Tags: nws

Unique Alert Counts
10 May 2016 05:35 AMSevere weather was abundant on Monday with damaging storms reported from Iowa to Texas. The NWS Des Moines issued a number of Tornado and Severe Thunderstorm Warnings along with a Severe Thunderstorm Watch. The featured top chart looks at the unique number of VTEC coded alerts that the office issues each year. The bottom chart explicitly lists out the unique codes used each year. Warning procedures have changed over the years, so some warning types are no longer used. This chart only covers those products that have Valid Time Extent Coding (which is most of the alert types), so the actual number of alert types is higher than shown.
Voting:
Good: 7
Bad: 3
Abstain: 1
Tags: vtec nws

Local Storm Report Sources
22 Apr 2016 05:34 AMThe National Weather Service collects reports of weather from the public and disseminates these reports in the form of 'Local Storm Reports' (LSRs). These LSRs denote a generalized grouping of where the report came from (source). The featured chart looks at the yearly rank of the source code used in LSR reports by NWS Des Moines. The ranking is simply a measure of the number of reports received and then disseminated by that source over the year. The LSR program has changed over the years with some source groups being converted into other headings. The general PUBLIC remains a major and important source of reports for the NWS. So keep letting them know when you witness significant weather.
Voting:
Good: 13
Bad: 4
Abstain: 3
Tags: nws lsr

Most Common NWS Alerts
05 Feb 2016 04:46 AMAfter the Blizzard Watch and Warning issued this week by NWS Des Moines, one may wonder how common it is to see this alert issued. The featured chart presents the top 25 most issued alerts by NWS Des Moines as measured by the unique number of forecast zones or counties alerted. For example, a Severe Thunderstorm Warning for portions of Polk and Story counties would count as 2 in this analysis. The percentages shown are relative to the most frequent product, the Severe Thunderstorm Warning. So the Blizzard Warning comes in at #18 and Blizzard Watch at #25, which makes the Severe Thunderstorm Warning approximately 12 and 25 times more common respectively. Please note that the time duration difference in alerts is not considered for this analysis.
Voting:
Good: 47
Bad: 34
Abstain: 35
Tags: nws warnings

2015 Tornado Watches
19 Aug 2015 04:12 AMA Tornado Watch was issued Tuesday afternoon for portions of eastern Iowa. Thankfully, only a possible brief and weak tornado has been reported so far in Iowa. For some counties in northeastern Iowa, this was the first tornado watch of the season. The featured map displays the number of Tornado Watches issued by county so far this year. There are nine counties shown without a watch this year! The highest totals are found in southeastern Iowa with Scott and Des Moines county at seven. You can generate this map online for other warning types, other states, and even other WFOs in the country.
Voting:
Good: 12
Bad: 5
Abstain: 7
Tags: warnings nws

Watch Duration
22 Jun 2015 05:43 AMThe NWS issued a Tornado Watch for much of southeastern Iowa on Saturday afternoon. Polk County (Des Moines) was initially included in the watch, but was removed after just 1 hour and 49 minutes as the storms fired east of the county. The featured chart looks at the frequency of tornado watch duration for the county. Two lines are plotted, the initial line represents the watch duration as initially issued, the final line presents what the final result for duration was (some watches/warnings can be extended in time / cancelled early). So having a 2 hour tornado watch is about a 1 in 10 frequency based on data back to 2005.
Voting:
Good: 16
Bad: 9
Abstain: 5
Tags: warnings nws
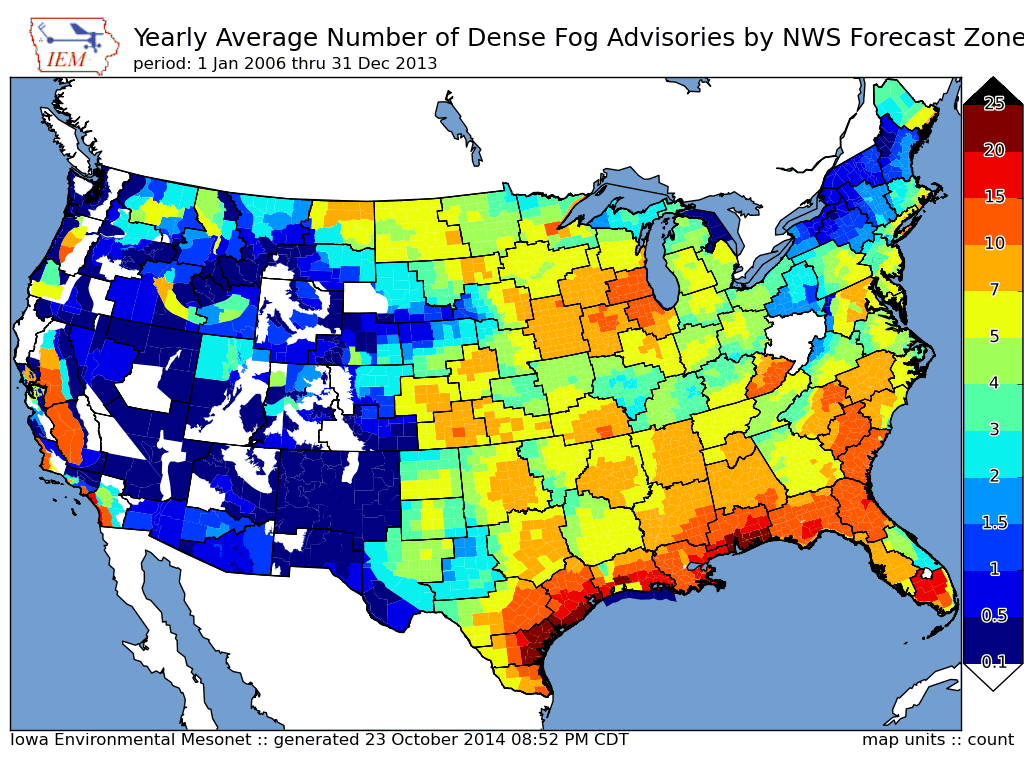
Dense Fog Advisories
24 Oct 2014 05:44 AMAfter the rain yesterday, skies cleared off and temperatures cooled creating dense fog this morning. The National Weather Service has much of the state under a Dense Fog Advisory this morning. The featured map displays the yearly average number of Dense Fog Advisories issued by forecast zone. The lines on the map are the edges of NWS forecast office zones. For Iowa, most of the state is in the 7-10 advisories per year range. The highest frequencies are near the Gulf of Mexico as the warm and humid air comes onshore and cools, creating fog. There is an interesting white patch over West Virginia. This is the Charleston, WV forecast office, which according to IEM databases has not issued a Dense Fog Advisory since at least 1 Jan 2006.
Voting:
Good: 28
Bad: 12
Abstain: 9
Tags: nws fog

Watch into Warning
06 Jun 2014 05:42 AMThe Storm Prediction Center issued a tornado watch for portions of northwestern Iowa on Thursday evening. Thankfully the tornado threat did not materialize and no warnings were issued for Iowa after the watch came out. How common is it to have a tornado watch and then not a warning for a given county in the state. The featured map attempts to answer just that question with the percentage of events whereby a county under a tornado watch gets a tornado warning issued. While the percentages may appear low, they do roughly match the spatial confidence of a watch issuance. The overall map average is near 15%. Winneshiek County has the lowest percentage (0%: only 3 tornado warnings since 2005 and all not within a tornado watch) and Pocahontas County has the highest percentage (29%).
Voting:
Good: 47
Bad: 22
Abstain: 15
Tags: tornado nws watch warnings

Svr/Tor Warning during Blizzard Warning
22 Feb 2014 09:22 AMThe recent blizzard event on Thursday featured a somewhat rare combination of a forecast zone being under a blizzard warning and also having a severe thunderstorm warning active at the same time! The featured chart presents an IEM computation of the number of times this has happened since late 2005. This combination happens approximately once each year for some lucky location in the country.
Voting:
Good: 31
Bad: 6
Abstain: 3
Tags: nws blizzard
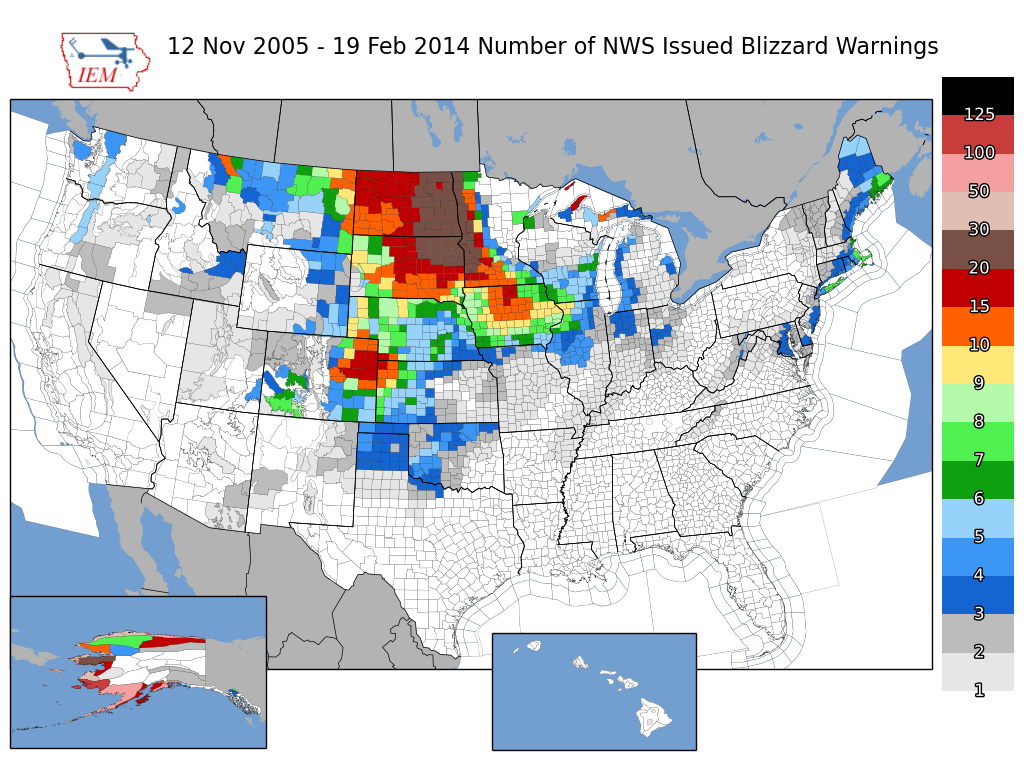
Blizzard Warnings
20 Feb 2014 05:16 AMBlizzard warnings are active for today as a major winter storm strengthens over the plains. The featured map presents the number of NWS issued Blizzard Warnings since late 2005. You'll want to click the image for a better view. Blizzard conditions are not trivial to produce as the combination of near zero visibility needs to coincide with snow and very strong winds. The map shows the favored area for these conditions over very flat and mostly tree- less Upper Midwest. The gradient is clear in Minnesota as trees slow surface winds down and help keep blowing snow in check.
Voting:
Good: 47
Bad: 6
Abstain: 5
Tags: nws blizzard
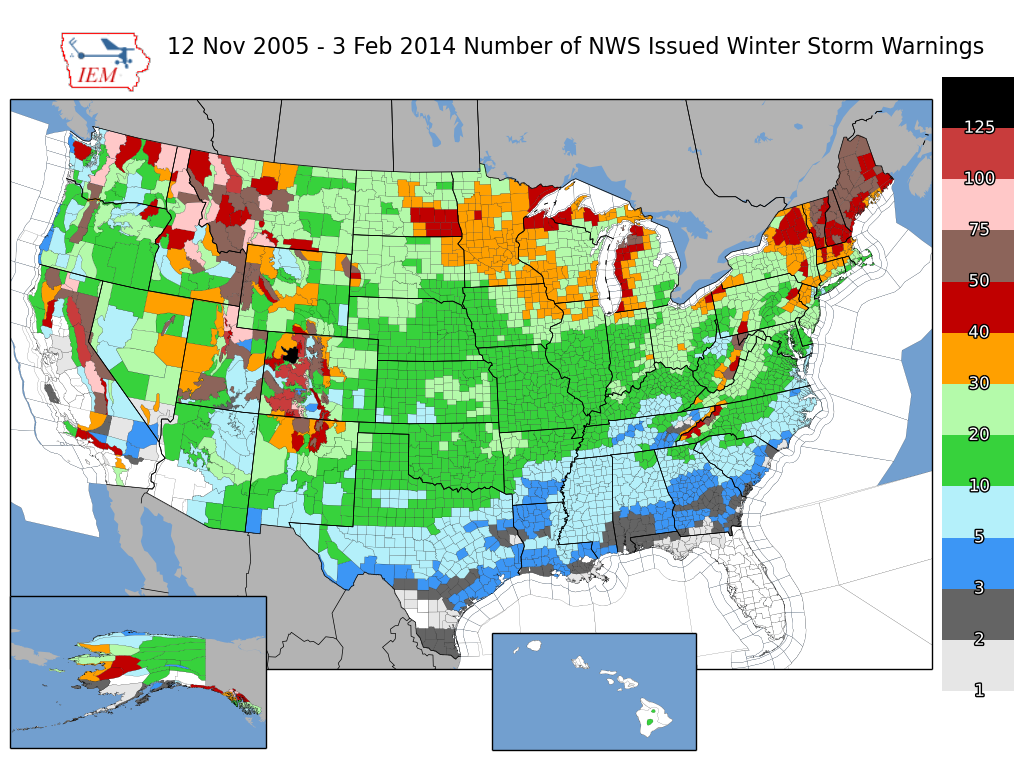
Winter Storm Warnings
04 Feb 2014 05:45 AMThe NWS has a Winter Storm Warning in effect for much of southern Iowa from today into Wednesday morning. The featured map presents the total number of Winter Storm Warnings issued by the NWS since late 2005. Northeastern Iowa has the largest totals in the state with the largest total (130) in the country for Flattops forecast zone in Colorado. Winter Storm Warnings are typically issued for significant snowfall accumulations over a twelve or more hour period. Our snowfalls so far this winter have not been excessive, so the number of warnings issued has been lower than recent average.
Voting:
Good: 61
Bad: 16
Abstain: 8
Tags: nws winter

Daily Warning Frequencies
25 Jun 2013 05:13 AMThe featured chart displays two daily frequencies of tornado and severe thunderstorm warnings in the United States. The green bars are the percentage of years since 2002 that at least one tornado or severe thunderstorm warning occurred on. The blue bars are the simple average number of total warnings issued per day. So while the number of warnings peaks in mid June, just about every day during the summer season sees severe weather somewhere in the US. In fact, this chart shows there has not been a day in July without severe weather since 2002. More severe weather is possible today in Iowa along with continued heavy rainfall events.
Voting:
Good: 83
Bad: 17
Tags: nws severe

The Last Tornado Warning
10 May 2013 05:15 AMThe Des Moines NWS Office released a statement yesterday noting that a tornado has not been reported in the state since 24 May 2012. Since 1950, this is the second longest streak on record for Iowa and only a few days away from the longest tornado-less streak back in 1955-1956. The featured map presents the number of days since the last tornado warning by NWS Office. For the Des Moines and Davenport offices, it has been over a year since the last tornado warning. Interestingly, this drought extends southwest to offices like Pleasant Hill (Kansas City) and Topeka, which are certainly in the traditional "Tornado Alley".
Voting:
Good: 172
Bad: 19
Tags: nws

Blizzard Warning Climatology
17 Mar 2013 03:55 PMBlizzard Warnings are in effect over far northern Iowa for Monday thanks to a quick moving storm system that will dump snow and then blow it around a bunch. Are blizzard warnings common as we are mere days from spring? The featured chart attempts to provide a climatology of blizzard warnings in the continental US by week of the year. The unit is the combination of a single NWS weather forecast office issuing a blizzard warning for a given week of the year. For example, the peak value in late December represents, on average, seven NWS offices issuing at least one blizzard warning per year. The chart shows a remarkable drop during the heart of winter in January. The reason for this drop is that blizzard systems are driven by large temperature gradients and amble supplies of moisture, both of which are somewhat limited in January as most the country is at its coldest.
Voting:
Good: 7
Bad: 2
Tags: blizzard nws

100% Chance
19 Feb 2013 05:41 AMThose of you that fervently monitor the NWS forecast may have noticed something interesting this past Sunday. For some locations in the state, the NWS had a near 100% chance of precipitation forecasted for Thursday. Is it common to see a 100% chance forecast at four days out? The featured chart shows the frequency of this confident forecast based on the afternoon zone forecast for Polk County (Des Moines). Based on data back to 1 Jan 2009, this would appear to be the first time it has happened for the day 4 forecast for Polk County. The chart nicely shows that forecasters get more confident of predicting a 100% chance as the event gets closer. Today's forecast for Thursday remains at 100%!
Voting:
Good: 35
Bad: 2
Tags: zfp forecast nws

Year to date warnings
07 Sep 2012 05:40 AMOur recent weather has seen a stormy change when compared with the drought filled summer. One reflection of this is shown by the featured chart of accumulated severe thunderstorm and tornado warnings for each of the past five years. The top chart shows the nationwide accumulation while the bottom chart is for warnings issued by the NWS offices with Iowa coverage (includes some warnings slightly outside of Iowa). A logical correlation with drought conditions is the lack of heavy rainfall associated with severe thunderstorms. After being ahead of each year in late May for Iowa (purple line), the lack of many summertime storms now has 2012 as being the least of the past five years in early September.
Voting:
Good: 115
Bad: 17
Tags: nws 2012

2011: Plenty of Severe Weather
01 Jan 2012 02:14 PMWith the new calendar year, it is probably a good time to reflect back on 2011. The previous year will be remembered as an infamous year for deadly tornadoes in the US. The featured chart presents the yearly total of NWS issued severe thunderstorm and tornado warnings dating back to 1986 along with the total area covered by these warnings. The area value is expressed in normalized units of the size of the continental United States. For example, enough warnings were issued this past year to cover the CONUS seven times over. The total number of warnings came in slightly behind 2008. The large drop in areal coverage of warnings is due to the change to storm based warnings in 2008, which warns for only partial areas of counties.
Voting:
Good: 9
Bad: 2
Tags: 2011 nws warnings
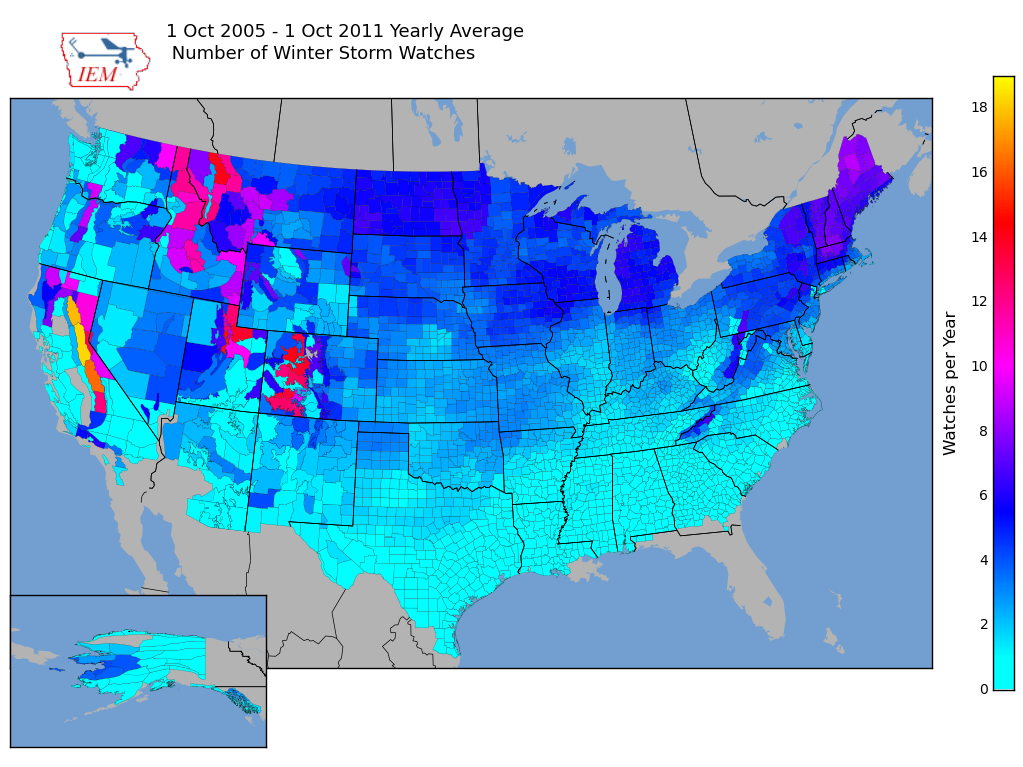
Winter Storm Watch
08 Nov 2011 04:11 AMA winter storm watch was in effect for portions of Iowa this evening and tomorrow for an approaching winter storm. The watch was upgraded to a winter weather advisory with a few inches of snow expected. The featured map presents the frequency of winter storm watches for the past six years. Most of the state is shown in the 4-8 watches per year.
Voting:
Good: 20
Bad: 2
Tags: nws

Tornadoes again
06 Sep 2011 05:55 AMThe remnant of Tropical Storm Lee has been causing all kinds of grief over the southeastern US. A number of tornadoes were reported on Monday along with 99 tornado warnings issued. The featured map presents the number of county based tornado warnings issued so far this year. The largest total is 35 for Madison County, Alabama (Huntsville). More tornadoes are possible today over the Carolinas.
Voting:
Good: 14
Bad: 6
Tags: nws warnings
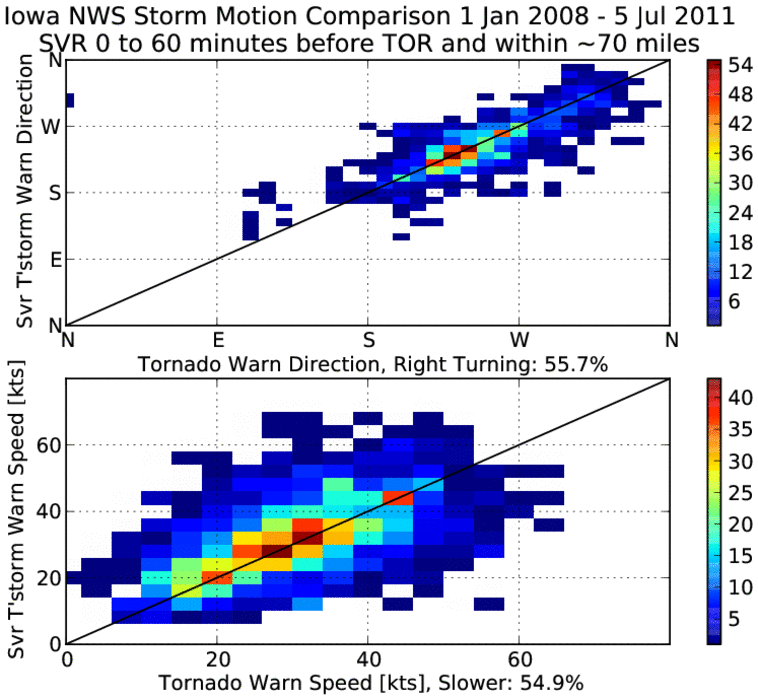
Right Turners
07 Jul 2011 05:43 AMFollowing up on yesterday's feature, today's looks at a comparison of tornado warned storm motion versus the severe thunderstorm warnings near in both space in time. Sometimes the sign of a storm that can produce a tornado is when the storm's path deviates from others around it. Typically, this deviation is a slight turn to the right (called right turners). Based on forecasted storm motions, just slightly more than half of the storms exhibit some bit of right turning. Another aspect to "right turners" is a decrease in speed as the storm's circulation strengthens. Again, just over half have forecasted speeds below those of warned severe thunderstorms around it. This is by no means an exhaustive look at this topic, but hopefully an interesting chart nonetheless. The bottom chart does contain an interesting dual maximum (25kts and 40kts) that may be a sign of a separation between isolated supercells (slower speeds) with linear convective complexes (typically faster moving).
Voting:
Good: 12
Bad: 5
Tags: nws warnings

Severe Storm Motions
06 Jul 2011 05:40 AMA severe thunderstorm developed over northcentral Iowa Tuesday afternoon and marched mostly south. This storm motion is not what we typically expect in Iowa of west to east moving storms. When the NWS issues severe thunderstorm warnings, they include a storm motion. The featured chart summarizes these storm motions issued by NWS offices with jurisdiction over Iowa. The upper chart presents a comparison between storm direction and date of year. It shows the favored direction of travel from the southwest in June to more west- northwesterly in July. The bottom chart compares storm speed with direction of travel. The fastest storms are clearly from the southwest with the largest concentration around 30 knots from the west. So our storms from the north-northwest on Tuesday are a bit rare, but not nearly unheard of like storms travelling from the east to west!
Voting:
Good: 16
Bad: 2
Tags: nws warnings

Blizzard Criteria
12 Dec 2010 12:32 PMWith the entire state under a blizzard warning during portions of Saturday and Sunday, one may wonder if the entire state experienced blizzard conditions. The term blizzard is typically applied to a period of at least three hours where visibilities are less than 1/4 mile due to snow or blowing snow along with wind speeds at or above 35 mph. People typically do not stand outside during strong winter storms, so it is hard for them to meet the three hour requirement and only report an instantaneous blizzard. Automated weather equipment struggles at low visibilities... The featured chart shows a comparison between reported three hour visibilities and wind speeds. Both plots contain two sets of data. The 'best wind' dataset includes the variable combination when winds were the strongest. The 'best vis' contains the observations when visibilities were the lowest. The x-axis is shown in log format, so to visually see smaller values. The left hand chart uses max/min values over the three hours, while the right hand chart uses simple averages (helping out the wind criteria). Even using the more lenient method, only ~20% of the sites in Iowa hit blizzard criteria in this qualitative form. For those that were outside, they probably considered the weather blizzard like.
Update: NWS Directive has the blizzard warning criteria as "Sustained wind or frequent gusts greater than or equal to 35mph accompanied by falling and/or blowing snow, frequently reducing visibility to less than 1/4 mile for three hours or more." (but no definition of what "frequently" means)
Voting:
Good: 39
Bad: 10
Tags: winter1011 blizzard nws

Severe totals
21 May 2010 05:09 AMThe featured chart displays the total number of tornado and severe thunderstorm warnings issued in Iowa up until 21 May since 1986 as computed by the IEM. While 2010 has seemed quiet, our pace is ahead of the past two years. There has certainly been a lack of tornadoes with the red bar showing one of the lowest totals in the past 10 years. The Storm Prediction Center has Iowa in a slight risk for severe weather on Sunday.
Voting:
Good: 48
Bad: 11
Tags: nws

Warnings by Hour
09 Apr 2010 07:09 AMThe featured image displays a climatology of NWS issued tornado and severe thunderstorm warnings by month and by hour. In general, these warnings are issued during the spring and summer months in the late afternoon into the evening. The month of June sticks out as the most active month and the winter months the least.
Voting:
Good: 46
Bad: 12
Tags: climate nws
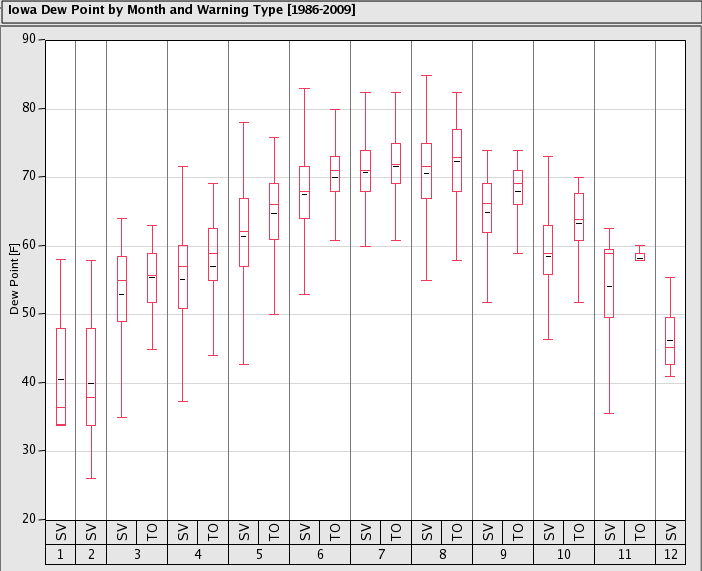
Dew Points and Severe Weather
05 Apr 2010 05:09 AMThe featured chart presents a quick analysis of near storm environment for the archive of NWS issued Tornado and Severe Thunderstorm warnings back to 1986 by month. The box and whisker plots help to visualize the range of values common during the issuance of the warning. In general, dew points are a bit higher for tornado warnings, which is expected as higher dew points indicate more energetic environments and perhaps higher relative humidities (lower cloud heights). For April, once the dew points reach the 50s severe weather appears to be more possible. Some severe weather occurred on Sunday over far southeast Iowa, where surface moisture was available (dew points much higher than the rest of the state). Higher dew points are expected to make their way north today with a warm front and our chances of severe weather will as well.
Voting:
Good: 18
Bad: 12
Tags: climate nws dewpoint

The first and the last
26 Mar 2010 05:10 AMOn Wednesday, a chart featured the slow start to the severe weather season in Iowa. Today's featured chart displays the period between the first and last Severe T'storm and Tornado Warning issued in Iowa. The year of 2008 really sticks out with period shown being nearly the entire year. The latest first warning was on 15 April of 2003, so we should see our first warning this year within the next few weeks.
Voting:
Good: 130
Bad: 22
Tags: nws

Slow start for severe weather
24 Mar 2010 05:09 AMThe featured chart displays the total number of tornado and severe thunderstorm warnings issued by the NWS for counties in Iowa. The top half of the graph shows the yearly totals up until 23 March and the bottom half displays the total for the year. 2010 has yet to see a warning issued in the state, but as other previous years show, a slow start does not mean the severe weather season will be a quiet one. The largest total on the chart for 2008 was after only having 4 warnings issued for the first part of the year.
Voting:
Good: 27
Bad: 4
Tags: nws

Last Warning
10 Mar 2010 05:12 AMFor most of the state, it has been a while since either a Tornado or Severe Thunderstorm Warning has been issued as is shown by the featured map. Please note that the map displays the warnings by county or forecast zone for simplicity. Generally, it has been over 6 months since Iowa has seen severe weather. March is the beginning of Iowa's severe weather season and strong storms are expected to stay just south of the state today.
Voting:
Good: 33
Bad: 5
Tags: nws

View larger image
Based on warnings issued by Davenport, La Crosse, Sioux Falls, Omaha, and Des Moines not just for Iowa.
One Inch Hail
27 Mar 2009 05:59 AMOn April 1st, National Weather Service Offices in the Central Region will be changing its severe weather warning criteria for hail size to one inch and larger (previously was penny sized 0.75). Some details behind the reason for this change can be found with this NWS webinar. The featured pie charts attempt to look forward to one probable outcome of this change, a decrease in the number of warnings. Of the 2200 warnings issued in the past two years, 24% of them were verified by only hail stones that would no longer justify a warning. The lower pie chart details the initial justification for issuing the warning based on product text. Please note the warning may have included a justifcation of damaging wind as well as hail, but this analysis only worries about what hail size was included. Half of the warnings issued mentioned hail sizes that will no longer be severe, again there may have been damaging winds mentioned in those as well.
Voting:
Good: 36
Bad: 18
Tags: hail nws

A weather potpourri
01 Oct 2004 08:23 AMLooking at the current map of watches and warmings we see that we have got about everything form of weather shown. A flood warming (in blue), a thunderstorm warming (in red), a wind advisory (in brown), and a frost advisory (in green) are all working to make Friday a wonderful day. You may want to tie down those gnomes in the backyard before the wind carries them away or that angry neighbour takes the opportunity to carry them away and blame the wind!
Tags: nws