Past IEM Features tagged: warnings

Busy Severe Weather Day
15 Mar 2024 05:30 AMThe first major and widespread severe weather day of the year happened on Thursday with large hail and tornadoes reported from Texas to Ohio. The featured chart presents an unofficial IEM accounting of the number of Severe Thunderstorm, Tornado, and Flash Flood Warnings active per minute during Thursday. The maximum of 16 simultaneous Tornado Warnings ranked in the top 10 largest for March events since 1986. The chart nicely illustrates the transition that often happens during most severe weather events as night time boundary layer stabilization leads to a decreased severe thunderstorm and tornado threat, while the flash flooding threat increases as rainfall totals pile up and thunderstorms train over the same locations.
Voting:
Good: 13
Bad: 1
Tags: warnings load

Saturday Storm Motion
31 Mar 2020 04:22 AMWhen the National Weather Service issues Tornado and Severe Thunderstorm Warnings, they include how fast and the direction of travel that the warned storm is taking. The featured chart presents this combination for Tornado Warnings issued by NWS Des Moines. Values for the severe storms this past Saturday are highlighted in red. The lines on the plot represent a kernel density estimate with the centroid located near 30 MPH from the west-southwest. This dominate storm motion reflects the prevailing westerly motion of the middle part of the troposphere, which generally guide storms for west to east. The preference for a more southwesterly component reflects a flow pattern that is more favorable for warm air transport from the Gulf of Mexico north and cooler air transport of Canadian air south. Tornado producing storms feed off these contrasts.
Voting:
Good: 10
Bad: 0
Tags: stormmotion nws warnings

2018 Severe T'Storm Warnings
28 Aug 2018 05:33 AMThunderstorms impacted Iowa on Sunday and again on Monday with an encore expected on Tuesday. Some of these storms warranted warnings, which are issued by the National Weather Service for distinct spatial polygon regions (called Storm Based Warnings). The featured map presents an accounting of the number of warnings per location in the state (discretized on a 1/100 of a degree grid). The locations in white are indicated to have gotten zero Severe Thunderstorm Warnings so far this year. The most active location on this map is northeastern Calhoun County. You can generate maps like this on the website for other locations, times, and severe phenomena of your choice!
Voting:
Good: 12
Bad: 0
Tags: 2018 warnings

Rare Storm Motion
22 Jun 2018 05:26 AMA pesky upper level low pressure system has been causing interesting weather these past few days. On Thursday, NWS Des Moines issued a number of Tornado Warnings for storms that were moving toward the northwest. Storms that move in that direction rarely get Tornado Warnings over Iowa. The featured chart displays a scatter plot and kernel density estimate for NWS Des Moines issued Tornado Warnings that include an analyzed storm motion. The red dots are from Wednesday's event and there is very little company for storms that have some westward moving component. The setup for storms moving in that direction to produce tornadoes is very rare in this part of the country. The chart shows the dominate storm motion of about 30 MPH from the WSW.
Voting:
Good: 13
Bad: 0
Tags: time...mot...loc warnings nws

Severe TStorm Warnings by Time of Day
29 Mar 2018 05:34 AMThis is Severe Weather Awareness Week in Iowa and Thursday's topic is family preparedness. Severe Thunderstorms are possible at any time of the day and at times when your family may not be home together. The point is to think about how your family receives warnings when not all together, takes action on those warnings, and advises each other of their status during and after the event. Along these lines, the featured chart presents the time of day frequency of Severe Thunderstorm Warnings issued by NWS Des Moines. While certainly there is a peak in frequency around 6-7 PM, the rest of the day are non-zero values meaning severe storms are possible during all hours of the day. Thankfully individual storm systems provide more narrowed threats in time and the vast majority of days in Iowa are severe storm free. These events are rare enough that it is important to raise awareness and review your action plans in early spring each year.
Voting:
Good: 11
Bad: 1
Tags: swaw nws warnings

The Gamut of Products
27 Oct 2017 05:35 AMOur first taste of winter arrived in force overnight with very chilly temperatures and even some snow! Of course, the fall season in Iowa can experience summer-like to winter-like weather. The featured chart presents NWS Des Moines issued headlines since the first of September. While there have not been all that many headlines issued, they do run the gamut of products issued by the NWS. The plot shows Severe Thunderstorm Warning, Dense Fog Advisory, Wind Advisory, Flash Flood Warning, Frost Advisory, and now even a Winter Weather Advisory.
Voting:
Good: 8
Bad: 0
Tags: warnings

Severe TStorm Warnings by Hour
14 Jun 2017 05:40 AMShowers and thunderstorms finally made a good push into the state overnight with a good portion of the state seeing some rainfall. A few of the storms were initially severe prompting the issuance of Severe Thunderstorm Warnings. The Sioux Falls NWS office issued some of these for portions of northwestern Iowa late last evening. The featured chart displays the frequency of warning issuance by hour of the day for the office. The chart shows a peak during the 6 PM hour and minimum during the late morning hours.
Voting:
Good: 8
Bad: 0
Tags: warnings

Most since 2006
26 May 2017 05:34 AMUnlike the past two years, the amount of severe weather we have seen in Iowa so far this year has been more active. The featured chart displays the number of Severe Thunderstorm Warnings issued by NWS Des Moines for the year to date period each year. This year's totals is the largest since 2006. A big caveat is that the mechanism for issuing warnings has changed over the years. Setting that aside, there are some limited chances of severe weather in Iowa over the holiday weekend, but the most significant storms look to stay to our south, especially on Saturday.
Voting:
Good: 10
Bad: 0
Tags: warnings

Severe Thunderstorm Timing
19 May 2017 05:34 AMLate Wednesday afternoon, severe thunderstorms raced through central Iowa prompting the NWS to issue a number of Severe Thunderstorm Warnings. These warnings were issued during the time of day that has approximately the highest temporal frequencies as shown by the featured chart for Story County. The plot presents frequencies on a minute- by-minute basis. It is kind of interesting to see no events at around 8 AM. Our severe weather typically develops to our west during peak afternoon solar heating and then trucks it into our area late evening. The overnight storms are a combination of these storms and those forced by something called the Low Level Jet, which pumps muggy air into the state fueling elevated thunderstorms with associated wind and hail threats.
Voting:
Good: 15
Bad: 0
Tags: warnings

View larger image
Generate This Chart on Website
0.5inch and 50mph thresholds are typically for forecasted values less than those levels.
Wind and Hail Tags
28 Mar 2017 05:33 AMThis is Severe Weather Awareness Week in Iowa, which features a different aspect of severe weather each day. On Monday, the focus was Severe Thunderstorms and the primary product the National Weather Service issues to alert of these storms is the Severe Thunderstorm Warning. These warnings contain tags identifying the magnitude of threats associated with the storm. The featured chart looks at the combination of wind speed and hail size tags included in warnings issued by forecast offices with Iowa coverage. The most common combination is of one inch hail and 60 MPH winds, which are the minimum thresholds for severe storms (strictly speaking, only one of the two is necessary and the wind threshold is 58 MPH). Thankfully for us, the frequencies of storms predicted to have giant hail and/or hurricane force winds (75+ mph) are rather small. One of the reasons these tags exist are to provide the NWS with an additional information point to alert the public to when these extreme severe thunderstorm events are predicted.
Voting:
Good: 7
Bad: 0
Tags: warnings

Warning Geometries
24 Feb 2016 05:34 AMSevere Weather hit the deep south on Tuesday with the NWS issuing a number of warnings for the event. These warnings are polygons outlining the geographical area under the threat. The IEM generates a daily summary image showing these geometries and the featured image is displays these sorted by size from largest to smallest. Many of these warnings have odd looking shapes due to long term political and policy issues with how NWS offices are permitted to issue such warnings. More severe weather is expected today, but the action again will be well south and east of Iowa.
Voting:
Good: 29
Bad: 20
Abstain: 20
Tags: sbw warnings

Most Common NWS Alerts
05 Feb 2016 04:46 AMAfter the Blizzard Watch and Warning issued this week by NWS Des Moines, one may wonder how common it is to see this alert issued. The featured chart presents the top 25 most issued alerts by NWS Des Moines as measured by the unique number of forecast zones or counties alerted. For example, a Severe Thunderstorm Warning for portions of Polk and Story counties would count as 2 in this analysis. The percentages shown are relative to the most frequent product, the Severe Thunderstorm Warning. So the Blizzard Warning comes in at #18 and Blizzard Watch at #25, which makes the Severe Thunderstorm Warning approximately 12 and 25 times more common respectively. Please note that the time duration difference in alerts is not considered for this analysis.
Voting:
Good: 47
Bad: 34
Abstain: 35
Tags: nws warnings
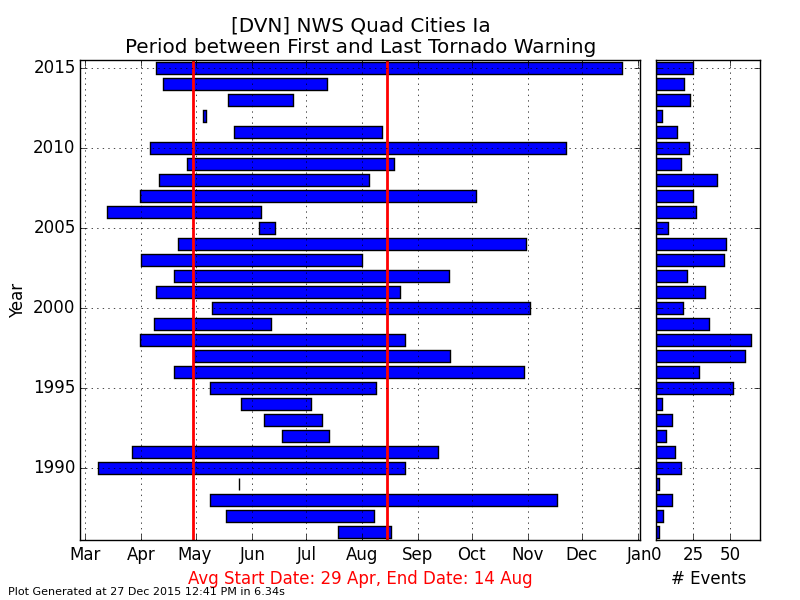
Late for a Tornado Warning
28 Dec 2015 05:36 AMLast Wednesday, the 23rd, the Davenport NWS Office issued a Tornado Warning that included portions of Scott and Clinton Counties in Iowa. This is the only December Tornado Warning for Iowa found in the IEM archives that date back since 1986. It is believed that prior to 1986, a few tornado warnings were issued in December for Iowa. Regardless, the featured chart displays the period between the first and last Tornado Warning issued by the Davenport Office. The average last date for a Tornado Warning is the middle of August!
Voting:
Good: 23
Bad: 13
Abstain: 8
Tags: warnings 2015

Winter Storm Warnings per Year
30 Nov 2015 05:36 AMThe National Weather Service has a Winter Storm Warning in effect for much of northwestern Iowa. Snowfall is expected to pile up in the area with totals topping six inches and higher. How common are these warnings issued? The featured map displays the yearly frequency of Winter Storm Warnings by Iowa county. The highest total in this chart is Clayton County averaging 4 warnings per year! It is interesting to see the SW to NE pattern over state.
Voting:
Good: 24
Bad: 12
Abstain: 10
Tags: warnings

Winter Storm Warning
25 Nov 2015 05:37 AMThe NWS Des Moines issued their first Winter Storm Warning of the season last week for the heavy snowfall event. This was the first such warning of the season and it came a bit sooner than recent year's average first date as indicated by the featured chart. The chart shows the period between the first and last Winter Storm Warning each winter season. The year shown is for the fall season portion of the season. Only 3 of the past 11 years are shown to have had such a warning in November. Of course, the plot also shows that there is plenty of winter season left with 4 more months of such warnings possible!
Voting:
Good: 15
Bad: 5
Abstain: 6
Tags: warnings

First and Last Severe TStorm Warning
11 Nov 2015 05:14 AMSevere weather appears to be likely today as a powerful storm system rapidly strengthens and plows east overnight. Severe Thunderstorm Warnings would appear to be likely with this event, but the calendar is well into November so one wonders if we have had such warnings this late into the year. The featured chart displays the period of days each year between the first and last Severe Thunderstorm Warning issued by the NWS in Des Moines. With data back to 1986, there have been a number of years with warnings into November and even December.
Voting:
Good: 14
Bad: 4
Abstain: 2
Tags: warnings

2015 Tornado Watches
19 Aug 2015 04:12 AMA Tornado Watch was issued Tuesday afternoon for portions of eastern Iowa. Thankfully, only a possible brief and weak tornado has been reported so far in Iowa. For some counties in northeastern Iowa, this was the first tornado watch of the season. The featured map displays the number of Tornado Watches issued by county so far this year. There are nine counties shown without a watch this year! The highest totals are found in southeastern Iowa with Scott and Des Moines county at seven. You can generate this map online for other warning types, other states, and even other WFOs in the country.
Voting:
Good: 12
Bad: 5
Abstain: 7
Tags: warnings nws

Watch Duration
22 Jun 2015 05:43 AMThe NWS issued a Tornado Watch for much of southeastern Iowa on Saturday afternoon. Polk County (Des Moines) was initially included in the watch, but was removed after just 1 hour and 49 minutes as the storms fired east of the county. The featured chart looks at the frequency of tornado watch duration for the county. Two lines are plotted, the initial line represents the watch duration as initially issued, the final line presents what the final result for duration was (some watches/warnings can be extended in time / cancelled early). So having a 2 hour tornado watch is about a 1 in 10 frequency based on data back to 2005.
Voting:
Good: 16
Bad: 9
Abstain: 5
Tags: warnings nws
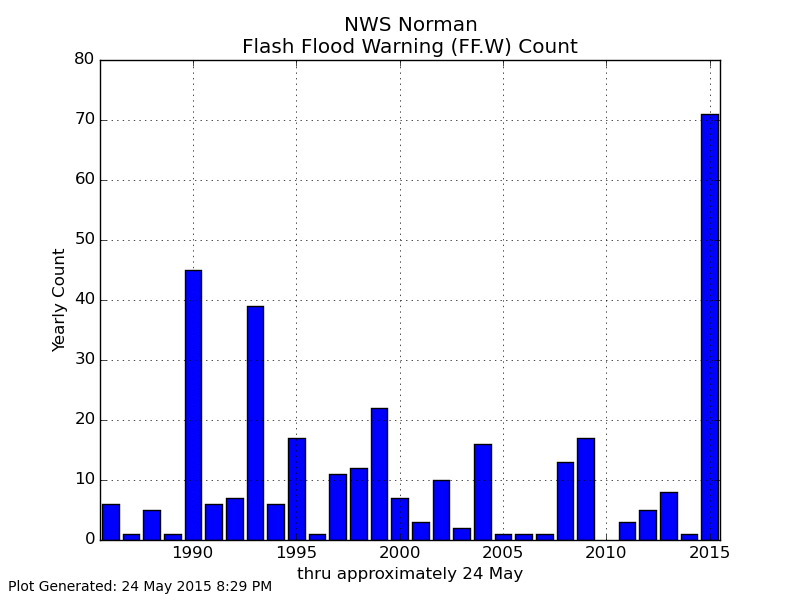
Norman Flash Flood Warnings
25 May 2015 05:57 AMThe big weather story in the US is the ongoing historic flooding in Texas and Oklahoma. A number of locations in the area have sent monthly precipitation records and there is more rain in the forecast today. The featured chart looks at the number of flash flood warnings issued by the Norman (Oklahoma City), Oklahoma NWS Office. This year's total dwafts other years for the year to date period. For the entire year, this year is only behind 1995 and 1999.
Voting:
Good: 11
Bad: 9
Abstain: 7
Tags: warnings

Days since last Severe Warning
01 Apr 2015 05:45 AMThe featured map displays the number of days since the last Severe Thunderstorm Warning issued by a local NWS Forecast Office. For Iowa, it has been over six months since the last Severe Thunderstorm Warning. This stretch looks to end today with the approach of a strong storm system from our west bringing thunderstorms into Iowa early this evening.
Voting:
Good: 23
Bad: 10
Abstain: 8
Tags: warnings

Wind Advisories
19 Jan 2015 05:43 AMGusty winds on Saturday prompted the NWS Des Moines to issue a Wind Advisories for portions of northern Iowa. The featured chart looks at how common the Wind Advisory is issued by week of the year. The top chart displays the number of years with at least one Wind Advisory for that week and the bottom chart displays the total number of advisories. The plot shows a peak number of events in April with near no events during the July- September period. Strong sustained winds are driven by temperature contrasts and during the summer months, these strong contrasts are difficult to find over the central US.
Voting:
Good: 16
Bad: 3
Abstain: 4
Tags: warnings

Yearly Warning Totals
19 Dec 2014 05:41 AMWith 2014 rapidly coming to a close, it is a good time to start recapping the year that was. The featured chart displays the year to date accumulated number of Severe Thunderstorm and Tornado warnings issued by the NWS for the United States. This year's accumulation looks remarkably like last years with both years on the lowest end of the past 12 years. There is a caveat to this chart as warning methodologies have changed over this time period. There are chances of more severe weather this year, but not for Iowa.
Voting:
Good: 26
Bad: 13
Abstain: 6
Tags: warnings

Wind and Hail
02 Jul 2014 05:39 AMWhen the local National Weather Service offices issue severe thunderstorm warnings, they include information on the magnitude of the hail and wind threat forecasted. So each warning contains expected hail size and wind speed. The featured chart presents the frequency of these threats since they were implemented in the warning product. Our most recent severe weather event on Monday had four warnings issued for 80 mph winds and seven warnings for two inch hail or larger. The hail size must be one inch diameter or larger to verify the warning. The wind speed must be greater than 58 mph for it to verify the warning.
Voting:
Good: 12
Bad: 8
Abstain: 5
Tags: severe warnings

Watch into Warning
06 Jun 2014 05:42 AMThe Storm Prediction Center issued a tornado watch for portions of northwestern Iowa on Thursday evening. Thankfully the tornado threat did not materialize and no warnings were issued for Iowa after the watch came out. How common is it to have a tornado watch and then not a warning for a given county in the state. The featured map attempts to answer just that question with the percentage of events whereby a county under a tornado watch gets a tornado warning issued. While the percentages may appear low, they do roughly match the spatial confidence of a watch issuance. The overall map average is near 15%. Winneshiek County has the lowest percentage (0%: only 3 tornado warnings since 2005 and all not within a tornado watch) and Pocahontas County has the highest percentage (29%).
Voting:
Good: 47
Bad: 22
Abstain: 15
Tags: tornado nws watch warnings

Svr Warnings by Week
27 Mar 2014 05:38 AMThis week is Severe Weather Awareness Week in Iowa and the featured chart looks at today's topic, Severe Thunderstorm Warnings. The chart displays the weekly frequency that at least one Severe Thunderstorm Warning was issued by the NWS per year. Four states are plotted for comparison. Iowa's season starts ramping up very late March and peaks mid July. Being the furthest north of the four states compared, it takes a bit for the really warm and moist air to reach us from the Gulf of Mexico. Severe Thunderstorm Warnings are certainly not too common during the winter months in Iowa as compared with the other states.
Voting:
Good: 17
Bad: 4
Abstain: 1
Tags: warnings

Follow Up Severe Weather
11 Oct 2013 05:39 AMA week ago Friday severe weather visited the state, including a recently rated EF-4 strength tornado near Correctionville. This event was the first severe weather warnings in 10 days prior. The featured chart looks at the frequency of follow up severe weather events after an event that was the first in ten plus days. The chart attempts to answer the question of how frequent are days with severe weather after an initial day that ended a recent drought of it. The data is partitioned by three periods of the year. Frequencies are higher during the summer season as severe weather is more common. There is some hint at an elevated frequency 5-7 days after the event, but nothing significant. The severe weather expected today will mostly miss us to our northwest.
Voting:
Good: 152
Bad: 119
Tags: warnings

Weekly Tornado Warnings
03 Oct 2013 05:36 AMThe weather is going to be very interesting over the next few days with chances of severe weather, including perhaps tornadoes, in the forecast. October is not a favored time of year for tornado warnings as shown by the featured chart. The chart shows the frequency of having at least one tornado warning issued for the given week of the year. For comparison, values for four states are plotted. Of course Texas is a very large state in Tornado Alley which helps its numbers. It is kind of interesting to compare the annual cycle for Iowa vs Oklahoma and even Alabama. Tornado Warning frequencies in Iowa drop to zero during the winter season while Alabama has the occasional event thanks to its proximity to the Gulf of Mexico. Please note that this type of comparison does not account for the total number of warnings issued but just attempts to diagnose annual climatology.
Voting:
Good: 75
Bad: 9
Tags: warnings tornado

2011: Plenty of Severe Weather
01 Jan 2012 02:14 PMWith the new calendar year, it is probably a good time to reflect back on 2011. The previous year will be remembered as an infamous year for deadly tornadoes in the US. The featured chart presents the yearly total of NWS issued severe thunderstorm and tornado warnings dating back to 1986 along with the total area covered by these warnings. The area value is expressed in normalized units of the size of the continental United States. For example, enough warnings were issued this past year to cover the CONUS seven times over. The total number of warnings came in slightly behind 2008. The large drop in areal coverage of warnings is due to the change to storm based warnings in 2008, which warns for only partial areas of counties.
Voting:
Good: 9
Bad: 2
Tags: 2011 nws warnings

Tornadoes again
06 Sep 2011 05:55 AMThe remnant of Tropical Storm Lee has been causing all kinds of grief over the southeastern US. A number of tornadoes were reported on Monday along with 99 tornado warnings issued. The featured map presents the number of county based tornado warnings issued so far this year. The largest total is 35 for Madison County, Alabama (Huntsville). More tornadoes are possible today over the Carolinas.
Voting:
Good: 14
Bad: 6
Tags: nws warnings
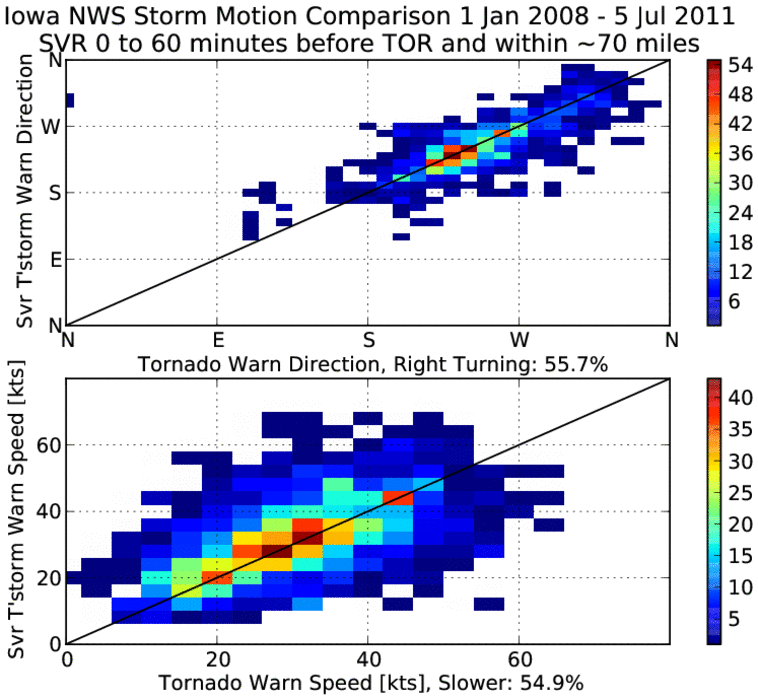
Right Turners
07 Jul 2011 05:43 AMFollowing up on yesterday's feature, today's looks at a comparison of tornado warned storm motion versus the severe thunderstorm warnings near in both space in time. Sometimes the sign of a storm that can produce a tornado is when the storm's path deviates from others around it. Typically, this deviation is a slight turn to the right (called right turners). Based on forecasted storm motions, just slightly more than half of the storms exhibit some bit of right turning. Another aspect to "right turners" is a decrease in speed as the storm's circulation strengthens. Again, just over half have forecasted speeds below those of warned severe thunderstorms around it. This is by no means an exhaustive look at this topic, but hopefully an interesting chart nonetheless. The bottom chart does contain an interesting dual maximum (25kts and 40kts) that may be a sign of a separation between isolated supercells (slower speeds) with linear convective complexes (typically faster moving).
Voting:
Good: 12
Bad: 5
Tags: nws warnings

Severe Storm Motions
06 Jul 2011 05:40 AMA severe thunderstorm developed over northcentral Iowa Tuesday afternoon and marched mostly south. This storm motion is not what we typically expect in Iowa of west to east moving storms. When the NWS issues severe thunderstorm warnings, they include a storm motion. The featured chart summarizes these storm motions issued by NWS offices with jurisdiction over Iowa. The upper chart presents a comparison between storm direction and date of year. It shows the favored direction of travel from the southwest in June to more west- northwesterly in July. The bottom chart compares storm speed with direction of travel. The fastest storms are clearly from the southwest with the largest concentration around 30 knots from the west. So our storms from the north-northwest on Tuesday are a bit rare, but not nearly unheard of like storms travelling from the east to west!
Voting:
Good: 16
Bad: 2
Tags: nws warnings

2011 Tornado Warning Counts
15 Jun 2011 05:52 AMThe featured map presents the number of tornado warnings issued by each NWS forecast office so far this year. The largest value is 179 by the Memphis office. This year has seen more than its fair share of tornadoes. The largest numbers of warnings are shifted a bit east of the traditionally known tornado alley. Iowa has seen its share of severe weather recently, but most of it has been hail and wind.
Voting:
Good: 18
Bad: 7
Tags: 2011 warnings

9 days over 100 warnings
27 May 2011 05:54 AMThe featured chart displays the number of tornado warnings issued by the NWS for each day this year. There have been 9 days with over 100 warnings issued per day. In total, there have been 3,147 tornado warnings issued so far this year. This total is only about 300 warnings shy of the entire year's total for 2010.
Voting:
Good: 25
Bad: 16
Tags: 2011 warnings

Busier than last year
18 Apr 2011 05:58 AMThis past weekend saw yet another severe weather outbreak with numerous tornadoes reported over the deep south. The featured map (click for a better view) shows the difference in number of severe and tornado warnings this year versus last year. Only counties shown in dark blue have seen a decrease. The deep south certainly stands out with Alabama having all counties with higher totals than last year. The total count in this plot is 4,779 warnings for 2010 and 14,517 warnings for 2011. The total count for 2011 is the largest on record for the period prior to 18 April.
Voting:
Good: 23
Bad: 4
Tags: 2011 warnings

Severe Weather in March
03 Mar 2011 05:57 AMThe numbers on the featured plot show the yearly average March temperature for Iowa. The location of the number represents the spatial center of mass for all the severe thunderstorm and tornado warnings issued for March during that year. The map is attempting to show the relationship between average temperature in Iowa to the favoured are to where severe weather happens. The warmest temperatures mostly appear to the west and north in this map, which makes some logical sense as warmer weather would promote severe weather further north near Iowa. The coldest temperatures imply that severe weather is pushed to the south away from the state. The limited area of this plot also suggests that most of the severe weather happens in this area during March.
Voting:
Good: 9
Bad: 29
Tags: march warnings