Past IEM Features tagged: march
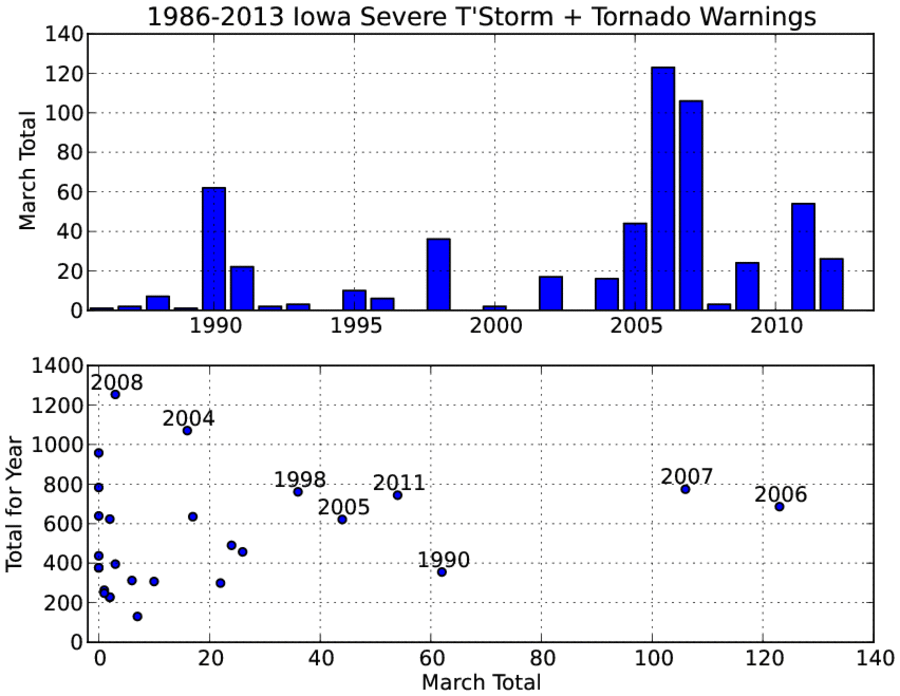
Non-severe March
01 Apr 2013 05:40 AMThis March finished without a severe thunderstorm nor tornado warning issued by the National Weather Service for Iowa. While March is typically an active month for severe weather in Iowa, there have been other years since 1986 like this March as shown by the featured chart. The bottom panel compares the March total number of warnings with the full year total. There is not much correlation between March and the rest of the year. We have yet to have an April without severe weather warnings since 1986. The first week of April looks to be mostly quiet with temperatures struggling today in the 30s!
Voting:
Good: 20
Bad: 4
Tags: march 2013
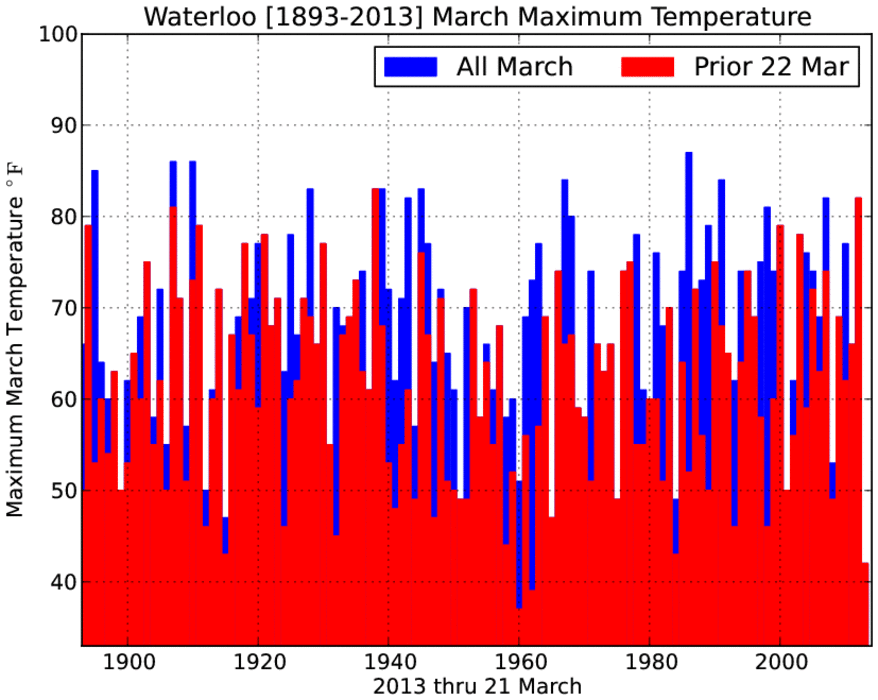
March Struggle
22 Mar 2013 05:40 AMDuring March of 2012, it was no problem for our temperatures to reach the 80s. During March of 2013, getting out of the 30s and 40s has been a struggle for most of Iowa. The featured chart presents the maximum temperature each March for Waterloo. The warmest temperature so far has only been 42 degrees. If this holds, it would easily be the coldest maximum temperature for Waterloo since 1893. The stacked bars represent the highest temperature prior to 22 March and then for the entire month. 1960 and 1962 had a colder temperature to date, but highs were warmer later in the month. 1962 was even able to reach the upper 60s after such a cold start. The forecast, at this point, does not provide hope for a similar event happening this year.
Voting:
Good: 43
Bad: 10
Tags: march
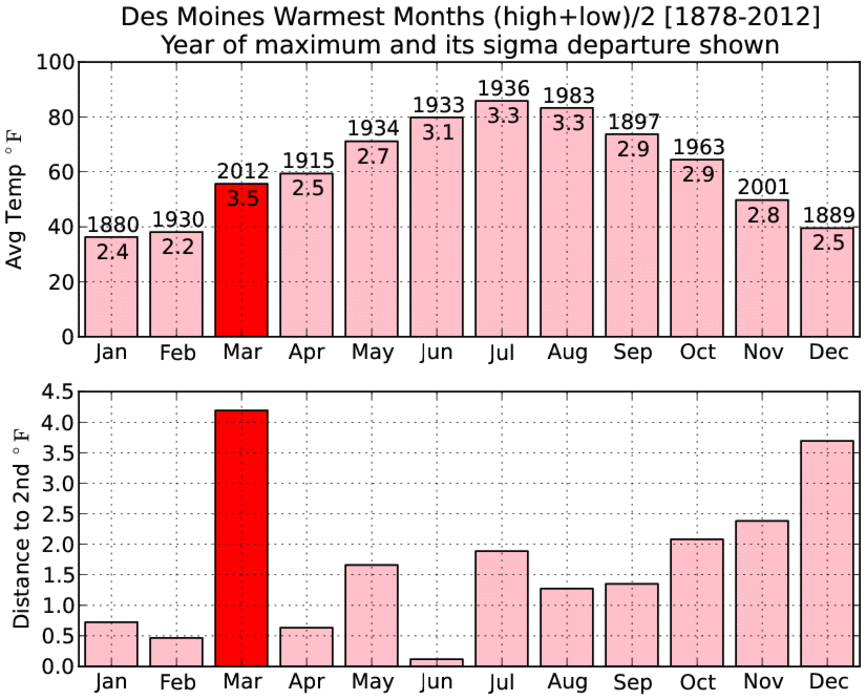
Relatively warmest month on record
01 Apr 2012 08:25 PMOur recently finished month of March has rewritten the record books in the Upper Midwest and in some respects, was relatively warmer than the iconic months during the dust bowl era! The featured chart presents the monthly record temperatures for Des Moines. The top chart presents the record temperature along with the year it occurred and the sigma departure the value was from current day average. The bottom chart presents the amount the current record is warmer than the second warmest month on record. The value of 3.5 sigma is shown for March 2012, which is larger than any of the other months. The sigma value represents how far the observation is away from the mean distribution of climatology. It provides a simple, but not complete, means to compare different months of the year. Regardless of that comparison, the bottom chart shows another exceptional aspect by besting the previous record by over four degrees! In this regard, this month is the most exceptionally warmest as well! Amazing to think about what we just experienced in the context of climatology for Iowa!
Voting:
Good: 30
Bad: 9
Tags: march month climate

Warmest stretches in March
14 Mar 2012 05:54 AMWe have just started what appears to be a very warm stretch of weather in March. The featured chart presents the warmest periods in March as measured by the minimum high temperature over a given number of days. For example, the coolest high temperature during 1910 was just 40 degrees for the entire month. For Ames, the longest period of temperatures at or above 70 is 12 days and at or above 80 is 4 days. One has to continue to wonder how we will eventually pay for all of this warm winter weather!
Voting:
Good: 18
Bad: 7
Tags: march

Frozen March Days
14 Mar 2011 05:53 AMTemperatures struggled on Sunday to rise above freezing over a good portion of the state. The featured chart presents the observed frequency of having the high or low temperature below freezing for a given day in March. While having low temperatures below freezing is still very common for the 13th of March, having the high temperature below freezing is a once every 5 years event. Warmer temperatures are in the forecast for this with highs in the 50s and 60s!
Voting:
Good: 10
Bad: 7
Tags: march

Severe Weather in March
03 Mar 2011 05:57 AMThe numbers on the featured plot show the yearly average March temperature for Iowa. The location of the number represents the spatial center of mass for all the severe thunderstorm and tornado warnings issued for March during that year. The map is attempting to show the relationship between average temperature in Iowa to the favoured are to where severe weather happens. The warmest temperatures mostly appear to the west and north in this map, which makes some logical sense as warmer weather would promote severe weather further north near Iowa. The coldest temperatures imply that severe weather is pushed to the south away from the state. The limited area of this plot also suggests that most of the severe weather happens in this area during March.
Voting:
Good: 9
Bad: 29
Tags: march warnings

Lack of wind
25 Mar 2010 05:09 AMIf March has seemed a bit too quiet to you, it is probably because of the general lack of windy conditions that we often remember with March. The featured chart displays the average wind speed for March by year at the Des Moines Airport. Only 1994 is shown with a lower average speed than 2010 since 1970. The red line displays the climatological average of 11.6 miles per hour. Some stronger winds are expected today and tomorrow as a storm system passes by.
Voting:
Good: 23
Bad: 8
Tags: march