Past IEM Features tagged: precip

Possible 90 Day Departures
16 May 2024 05:30 AMPrecipitation departures are an interesting statistic. Unlike temperature departures which tend to have equal magnitude departures possible in both cool and warm directions, negative precipitation departures are bounded by climatology (i.e. you can't have a negative departure). Rewording, if your climatological average precipitation for the month is three inches and you receive zero, the maximum below average departure possible is three inches. The featured chart takes a bit of a deep dive into 90 day trailing precipitation departures by day of the year for Des Moines. The data is presented as a heat map, which represents the number of times (read years) a given departure has happened on the given date. There are many neat aspects found in the chart. The red line represents the maximum negative departure over 90 days when the observed precipitation is zero. Since we get much less precipitation during the cold season, the largest possible negative values are much smaller. And accordingly, the largest observed positive departures are much smaller as well. The right hand histogram shows that most of the distribution is found below 0, which is a sign that the precipitation distribution is skewed and not normally distributed. Another interesting aspect are the downward streaks found during April into the July. These are due to climatology slowly increasing each day, so dry days will more rapidly pull departures more negative than during other times of year.
Voting:
Good: 8
Bad: 0
Tags: precip

Intense Precip Rates
03 Jul 2023 05:30 AMIt was another weekend with rain frequenting the state and much of southern Iowa fared very well. Some locations experienced very intense rainfall events with slow moving storms and an atmosphere loaded with water vapor helping to produce those totals. This is the favored time of the year for such intense rainfall events as shown by the featured chart. The chart presents an analysis of the rainfall product driving soil erosion estimates within the Daily Erosion Project between 2007 and 2003 for a location near Ames. This product is based on NOAA RADAR-based estimates along with some gauge quality control. They are peak precipitation rates over two to five minutes of time, so they are not an actual hourly precipitation total. The tan dots show the daily maximum values over this period and the black line is a four week centered smooth to remove some of the noise. The difference between the cold and warm season is readily apparent as rainfall rates are a function of the water holding capacity of the atmosphere and warmer air temperatures can hold more water. It is interesting to see the abrupt drop during October, which is likely being driven by the loss of plant transpiration and thus an important moisture source to the atmosphere.
Voting:
Good: 9
Bad: 0
Tags: precip

Oelwein Precipitation Departures
06 Jun 2023 05:30 AMThis week's update to the US Drought Monitor is released on Thursday and assesses the seven day precipitation ending Tuesday morning. Degradation seems to be a given with much of the state continuing to be mostly dry and warm temperatures increasing water demand. Over the past month or so, one of the driest areas of the state is found in northeastern Iowa at Oelwein. The featured chart presents a number of metrics evaluating precipitation totals or departures over a trailing number of days ending yesterday. The values on each chart represent the given date until June 5th, so they should somewhat be evaluated from right to left. The bottom left panel denotes the Standardized Precipitation Index (SPI) values within the drought monitor assessment. You can see that over different time scales, different drought threshold indicators are to be found. The present drought monitor value for the location is "D1", which is well supported by this plot dating back into late 2022. The short term is certainly much drier and the weighting of this year's growing season totals continue to increase in the drought monitor assessment as impacts (brown lawns, degraded crops, low streamflows, etc) increase.
Voting:
Good: 5
Bad: 0
Abstain: 2
Tags: precip

Days to Exceed Climatology
13 Jan 2023 05:30 AMYesterday's daily feature was a map presenting the minimum number of year to date days a given long term climate site took to reach its yearly climatology. This was in response to a location in California already exceeding its average yearly total. Since the start date of 1 January is a bit arbitrary, today's featured map presents the minimum number of days over any period to accumulate a year's worth of precipitation. This change normalizes the map somewhat and again, some interesting patterns can be seen. Iowa is shown in the 90 to 180 day range, which for an approximate yearly average of 30 some inches, would equate to three or more months in a row averaging ten inches per month. This maps has some neat regional patterns and again California sticks out for having sites in the one to seven day range!
Voting:
Good: 14
Bad: 0
Tags: precip

Exceeding Annual Climatology
12 Jan 2023 05:30 AMThanks to a significant and ongoing "atmospheric river" event, Bishop, California has already received more precipitation this year (5.00") than their annual climatology (4.84"). Based on NWS COOP sites with at least 50 years of data, the featured map presents the minimum year to date period that a given site was able to reach its present day annual precipitation total by. For example, sites in gray would have had at least one year with a year to date total by the end of January exceeding the yearly average. There is a nice and informative pattern to be seen over the contiguous US. Values in Iowa are in the July through August range, which means that the earliest a given site has received at least ~30 some inches of rain was by 1 July. Of course, having such an early date is only possible for sites that are already quite arid and can experience such significant events during the cold season.
Voting:
Good: 13
Bad: 0
Abstain: 2
Tags: precip

Severe Precip Contributions
17 Sep 2021 05:33 AMAn IEM Daily Feature earlier this week denoted the dearth of severe weather over Iowa and much of the Midwest US. Does the lack of severe weather imply a lack of precipitation as well? The featured chart uses one minute interval precipitation from the Des Moines airport and an archive of Severe Thunderstorm and Tornado Warnings to attempt to tease out an answer to this question. For the left two panels, periods when the airport was under a warning were totaled for precipitation along with an hour window around each warning (without another warning coincidentally active). The partitioning is shown with the legend denoting the overall precipitation total contribution. Roughly 10% of all precipitation falls during and close to these warnings. Individual years vary widely with some years near 20% contribution and others closer to a few percentage points. The right hand panel presents the frequency by minute accumulation that a warning was active. For example, when 0.10" of rain falls in a minute, there is either a tornado or severe thunderstorm warning active during 31% of these events. The relationship makes sense as more intense rainfall rates as typically associated with more intense convection.
Voting:
Good: 12
Bad: 0
Abstain: 1
Tags: precip

Precipitation Metrics
02 Jul 2021 05:37 AMDrought concerns are increasing as warmer and drier weather is once again dominating the state. The last half of June was wet for some portions of Iowa, but many areas missed out. The featured chart presents a number of precipitation metrics for Ames. The individual charts express precipitation metrics from the given date until 1 July 2021, so you may want to read them from right to left. For example, the first few points of each line represent the 365 day period stretching back to July 2020 and the last few points represent the last few days of data this year. The US Drought Monitor is not a simple assignment of one single precipitation metric over one interval, but lookup values do exist for the Standardized Precipitation Index (SPI) as highlighted by the lower left panel. The current classification is D2 for Ames and the data supports that over the 60-90 day period. The right most portion of each subplot should be taken with a grain of salt as a small number of days and individual rain storms lead to noisy data.
Voting:
Good: 10
Bad: 1
Tags: precip

Harvey Rain Rates
04 Sep 2017 06:27 AMThe featured table presents an analysis of available one minute interval precipitation observations from ASOS sites near Hurricane Harvey in Texas. While the total column simply presents the six day precipitation total, the other seven columns show the computed hourly precipitation rate based on actual totals over the given period. The chart shows some mind blowing rates experienced of over ten inches per hour at the one minute timescale and even over four inches per hour on the hourly time scale.
Voting:
Good: 8
Bad: 0
Tags: hurricane precip

Just Five Hours this June
21 Jun 2016 05:34 AMThe featured chart displays the number of hourly observations that reported precipitation for the Des Moines Airport weather station. The chart displays the average total, this year's total and the maximum total for each month of the year. The paltry total of just five hours this month for Des Moines is well below the average of 27. Actually precipitation totals are well below average for the site as well.
Voting:
Good: 13
Bad: 0
Abstain: 1
Tags: precip

Precipitation Contributions
11 May 2016 05:33 AMThe IEM processes a dataset of one minute interval precipitation observations from the Des Moines Airport. Using this dataset, we can compute the average contributions to yearly totals for each minute precipitation rate. The two values shown are total number of minutes with precipitation and total precipitation volume. The sensor records the data in an increment of 0.01 inches, so that intensity is the lowest observable and the plot shows that it dominates the count and volume percentages. Rewording, over 80% of the minutes that reported precipitation and over 60% of the total rainfall fell at minute rates of only 0.01 inches. So light rain is very significant to our yearly precipitation totals! The bottom chart displays the same data, but with a log scale y axis. The regime shift at 0.14 inches and higher is likely due to a quirk with how this dataset is reported. An under-catch multiplier is applied at such intense rates.
Voting:
Good: 10
Bad: 0
Tags: precip

Temps when Precipitating
02 May 2016 05:35 AMThis past weekend was a washout for most of Iowa with rain persisting over much of it. This rain fell at rather chilly temperatures in the 40s. The featured chart looks at the frequency of reported temperature when precipitation was also reported during an individual observation hour. For late April, having precipitation in the 40s is rather common so this is about what we would expect for this time of year.
Voting:
Good: 13
Bad: 1
Tags: precip

December Precip Hours
24 Dec 2015 05:40 AMWednesday was yet another wet December day over much of Iowa with rainfall totals approaching an inch for a swath of the state. The featured chart displays the number of hourly observations by month with measurable precipitation reported for Des Moines. The total hourly reports for December is the highest on record, according to the unofficial archive maintained by the IEM. It is also interesting to see that this month's total is higher than any other month this year! More chances for precipitating storms are in the forecast, so the total will likely be added to.
Voting:
Good: 30
Bad: 15
Abstain: 13
Tags: dec precip

Precip Record Destruction
15 Dec 2015 05:35 AMThe rainfall totals from our recent storm are destroying about every record that existed for precipitation totals during the cold season in Iowa. The featured chart displays the largest 24 hour areal averaged precipitation for Iowa during the December, January, and February season. The 1.51 inches estimated by the IEM for the 24 hour period ending at 7 AM yesterday is roughly 50% larger than the second place value! Individual station totals were even higher with places like Des Moines and Waterloo rewriting the record books for cold season precipitation. Given the intensity and time of year, this recent event may go down as the most extreme precipitation event Iowa has on record!
Voting:
Good: 51
Bad: 2
Abstain: 4
Tags: precip dec15

Driest Months
23 Oct 2015 05:36 AMWith just 8 hundredths of an inch of rain so far this month for Des Moines, it is one of the driest Octobers on record. The featured chart displays the minimum total precipitation for each month of the year for Des Moines. The record for October was a mere 3 hundredths back in 1952. This was also the month that was a part of the driest streaks of days on record for the site. Chances of rain are in the forecast, so it is likely that this year's total will be added to before the month is over.
Voting:
Good: 35
Bad: 21
Abstain: 24
Tags: precip

20 straight dry days
20 Oct 2015 05:36 AMIt is not your imagination, it has been very dry this October! For Des Moines, the last reported precipitation was 20 days ago back on 29 September. The featured chart displays the longest dry periods for Des Moines for each day of the year. The longest streak shown by the chart is 29 days back in 1952. This analysis counts trace reports as precipitation events. There is a chance of rain today and then again to end the week.
Voting:
Good: 14
Bad: 11
Abstain: 7
Tags: dry precip

Wet Day Average
21 Sep 2015 04:33 AMMuch of Iowa has seen a number of intense rainfalls this year. The featured chart presents the average daily precipitation on days with precipitation reported for each year for Ames. A long term mean, a mean calculated over the 1981-2010 period, and a trailing 30 year mean is shown as well to look for changes. This analysis does not show much change as they all are around 0.35 inches. If you assume a rough 35 inch per year annual total, you can back out around 100 days per year with precipitation which equates to 2.5 days per week with precip. The rain chances this week look to come around mid-week.
Voting:
Good: 16
Bad: 8
Abstain: 7
Tags: precip

Small Precip Biases
21 Aug 2015 05:38 AMLast week, a featured plot presented the bias associated with computing 24 hour high and low temperature by hour of the day. Today's feature does the same analysis, but with precipitation totals. The biases with precip are very small due to the nature of accumulating precip over the 24 hour period, which is a conserved amount when aggregated over time. The chart displays the bias with the total number of 24 hour periods with precip for the year ("rainy days") and the average 24 hour precip total when there is precip that day. The peak with number of 'days' is interesting at around 7 AM and 7 PM, the interpretation is that these are common hours for precip, so it is likely that the next hour will be precip as well. So splitting the day at that hour, will spill precip into a second 'day'. The values shown are small regardless, so the differences are likely negligible!
Voting:
Good: 24
Bad: 14
Abstain: 14
Tags: precip

Max Precipitation
30 Jul 2015 05:44 AMFor Sunday to Tuesday (3 days), the Des Moines Airport reported over an inch of rain each day. This is only the sixth such streak on record for the site. The featured chart presents some statistics on streaks of precipitation for the site. The green line represents the maximum value over which the number of days had daily precipitation at or above that level. The chart indicates that four days is the longest consecutive streak of daily rainfall over an inch. The blue line represents the highest daily average precipitation over a given number of days. You can multiple this value to get the actual maximum accumulation over that number of days, so for example the value of 2 at 5 days represents an accumulation of 10 inches. Or restating, the highest five day accumulation for the site is 10 inches.
Voting:
Good: 15
Bad: 8
Abstain: 6
Tags: precip

Precip Effectiveness
28 Jul 2015 05:41 AMNot all precipitation events are equal. The featured chart attempts to show which precip events are the most effective at producing rain over areas that actually need it. The top chart displays the areal coverage of daily precipitation over 0.5 inches and the amount of that area that was coincident with an area that had received less than 0.5 inches over the previous seven days. The bottom chart shows the area of the state that was below 0.5 inches over the past seven days and percentage of that area that got 0.5 inches that day. Confusing? The moral of the story is that some rain events happen over areas that are already wet making them less effective at relieving previously dry areas. You can generate this chart online for other years for comparison.
Voting:
Good: 16
Bad: 7
Abstain: 5
Tags: precip

Highest Rain Accumulations
12 Jun 2015 05:46 AMThe ASOS weather stations in the state record precipitation at one minute intervals. With this data, the featured chart presents the highest rainfall accumulation over a given number of minutes. This chart is useful from an engineering perspective as various structures are designed to handle a certain amount of water over a certain amount of time. There are numerous caveats to this chart including the fact that automated sensors struggle to accurately record these intense rates and the ASOS station includes an upward adjustment when rainfall rates get this high to account for under-catch. Having said all that, the chart does nicely illustrate the duration of the most intense thunderstorms. Since we are not situated against a mountain, storms have to move to maintain a source of energy, so the most rates are generally done within 30 minutes or so. Having sequential thunderstorms of this intensity is not going to happen as the atmosphere can not 'refill' its supply of water that quickly without the help of a mountain. There are some differences between the five sites plotted, but the differences are likely due to sensor / siting differences and not a physical explanation (perhaps). There is also only 15 years of data comprising this chart, so the sample size is a bit small.
Voting:
Good: 36
Bad: 24
Abstain: 22
Tags: precip rates

Spring Precipitation
05 Jun 2015 05:55 AMYesterday's feature presented the average spring season dew point and showed an increasing trend. Similarly, today's plot shows yearly spring season precipitation totals averaged over the state of Iowa and again, an increasing trend is shown. The right most bar on the plot would be this years total and it is slightly above long term average as well.
Voting:
Good: 33
Bad: 16
Abstain: 31
Tags: precip spring

Monthly Precip Hours
29 May 2015 05:43 AMWhile overall precipitation totals this month have not been too impressive, the number of hours on which it has rained has been much above long term average as shown by the featured chart. The chart shows the number of precipitation hours this year and a long term monthly average based on available archive of observations. You can generate this chart on the website for a year and observation site of your choice.
Voting:
Good: 22
Bad: 18
Abstain: 17
Tags: precip

Precipitation Bins
11 May 2015 04:17 AMThe featured chart looks at the distribution and contribution of daily precipitation to the year to date total of days with precipitation and total precipitation. The daily values are binned into groups that, on average, provide equal yearly totals of precipitation. For Ames, while the heaviest bin has yet to see an event, the second highest bin has seen double of the average number of events.
Voting:
Good: 10
Bad: 7
Abstain: 2
Tags: precip

Monthly Hours of Precip
19 Sep 2014 05:43 AMThe automated airport weather stations provide hourly reports of precipitation. The featured chart shows the number of hours that measurable precipitation was reported for this year and on average for Ames. This chart does not show the time duration of precipitation as an hourly report of precipitation does not mean it precipitated for the entire hour period. Anyway, this year has seen most of its months above long term average with August at about double of average. The forecast is mostly dry with some chances of rain today and Saturday.
Voting:
Good: 26
Bad: 18
Abstain: 21
Tags: precip

Precip Bins
03 Sep 2014 05:44 AMThe featured chart looks at the contribution to yearly precipitation total and number of rainy days that individual daily precipitation values have. For this analysis, the daily precipitation is binned into five ranges that over the long term history each contribute 20% to the yearly total precipitation. The bars represent the number of days per year with a daily precipitation within that range. For Des Moines, approximately 72 days per year receive between 0.01 and 0.29 inches of precipitation. The red bars represent what has happened so far this year, with the red labelled percentages indicating the departure the total rainfall for that bin has had this year. A lot is going on! For this year, the largest intensity bin has seen seven days versus just an average of three days and these seven days have exceeded the bin total accumulation by 24%. Of course, the 2014 values are still accumulating and the blue bars represent the full year average.
Voting:
Good: 11
Bad: 6
Abstain: 3
Tags: precip
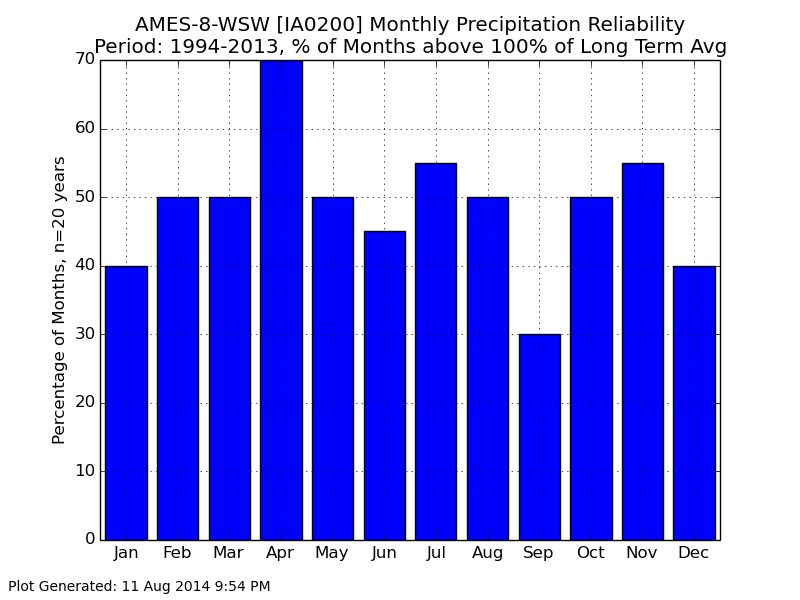
Precip Reliabillity
12 Aug 2014 05:27 AMAfter yet another recent wet spring, the later part of summer has turned dry again. The featured chart looks at the recent 20 years of monthly precipitation reliability. The metric plotted is the number of years that the given month had above 100% of average precipitation for the month. These values are for Ames. Rewording, 70% of the past 20 years had above average precipitation for April. So while April is shown with the highest value, September has the lowest at just 30%. This chart can be dynamically generated on the website, so please try different thresholds and periods to see what results you get!
Voting:
Good: 16
Bad: 6
Abstain: 9
Tags: precip
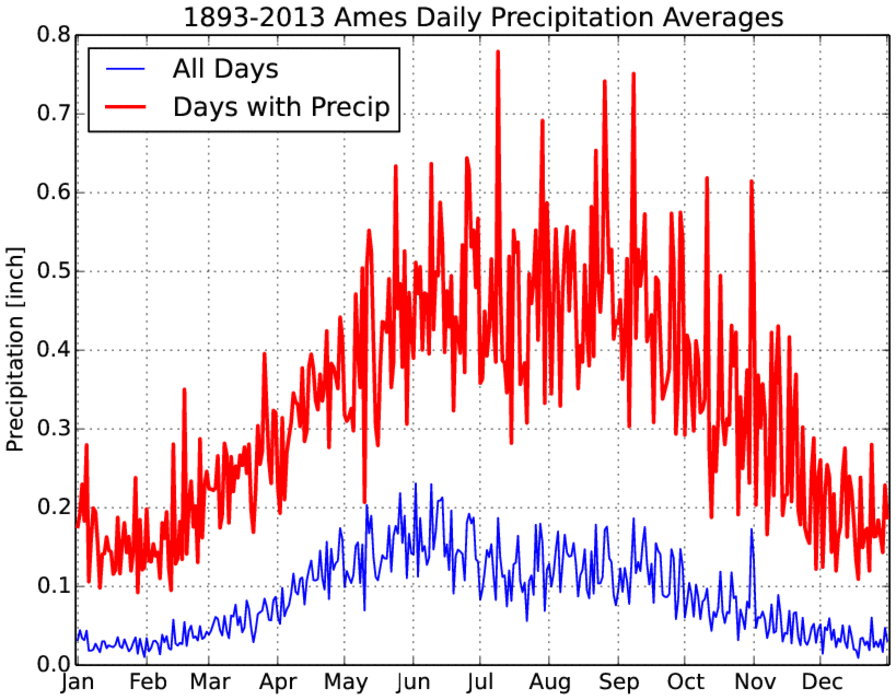
Daily Precipitation
11 Jun 2014 05:55 AMThe featured chart presents the daily climatology of precipitation for Ames using period of record data. The blue line represents the simple daily average of precipitation using all days and the red line is the simple average over only the days on which precipitation was reported. These two lines answer the question what is the average daily precipitation and what is the average daily precipitation when it actually precipitates that day. While the blue line peaks in early June, the red line plateaus through the summer. The nature of the summer time thunderstorms is rather consistent over the summer months, but their frequency decreases as the summer passes. So the blue line peaks during the peak in thunderstorm activity, while the red line decreases once we are out of summer and into September.
Voting:
Good: 11
Bad: 4
Tags: climate precip

Overnight Precipitation
03 Jun 2014 05:37 AMA large complex of thunderstorms are expected to fire to our west today and bring heavy rainfall and severe weather into Iowa on Tuesday evening and night. Nighttime precipitation is a very important part of Iowa's annual total. The featured map displays an IEM computed percentage of total precipitation during June, July, and August that falls during the twelve hours between 8 PM and 8 AM local time. All things being equal, we'd expect half (50%) of the precipitation to fall over a twelve hour period (50% of the day), but it does not work out that way for much of the country. A clear maximum appears over southwestern Kansas thanks to a phenomena known as the low level jet, which drives thunderstorms during the overnight hours and helps push them west through places like Iowa. Minimums appear over the deep south and desert southwest. These locations get summertime thunderstorms driven by peak heating from the sun driving instability.
Voting:
Good: 23
Bad: 8
Abstain: 2
Tags: precip jja summer
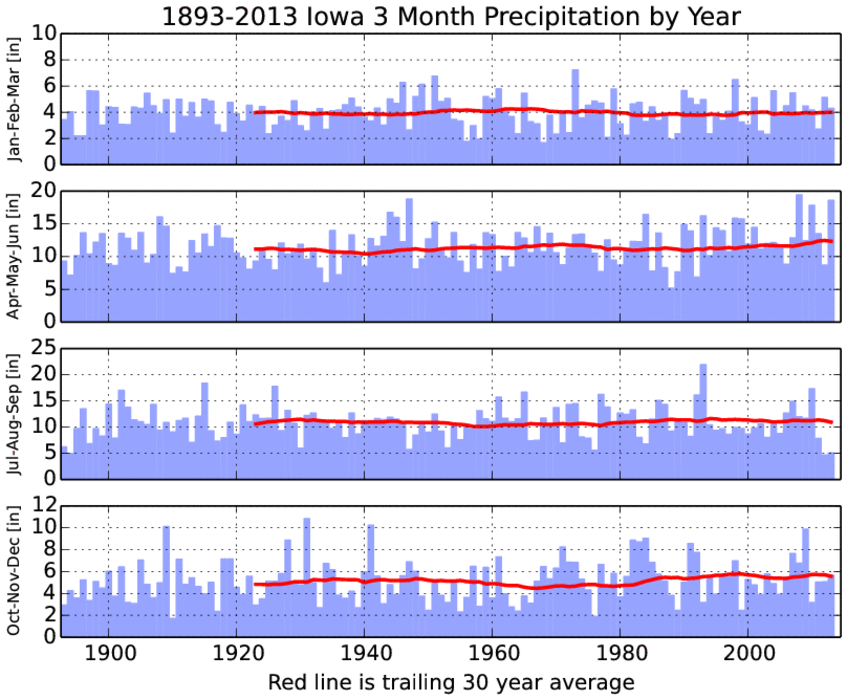
Seasonal Precipitation
24 Apr 2014 05:37 AMNeeded rainfall is currently falling over Iowa. This rainfall is needed due to the deficits that built up during the later part of the growing season in 2013. The featured chart presents the seasonal precipitation totals by year and a simple trailing 30 year moving average plotted as well. The recent few years have seen very dry conditions for the Jul-Aug-Sep period, but they have been compensated by wet springs. The complications with a wet spring are delays and difficulties with planting the agricultural crops.
Voting:
Good: 19
Bad: 4
Abstain: 4
Tags: precip climate
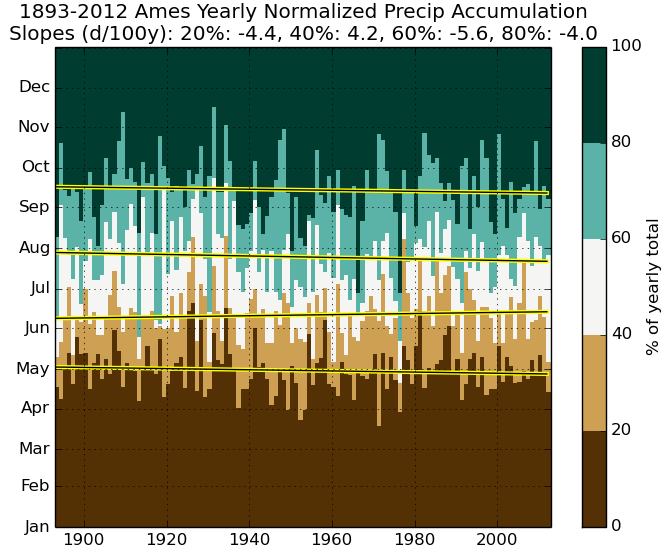
Accumulating Precip
15 Nov 2013 05:37 AMThis delightfully complex plot is an attempt to illustrate the changing seasonal contribution of yearly precipitation. Each column in the chart represents that year's worth of precipitation. The plot is normalized so the accumulated precipitation for that year is expressed in percent total of that local year. The color ramp provides breaks at the 20, 40, 60, and 80 the percent. For these four levels, a linear regression fit is shown with the slope of that line presented at the top in units of days per century. With me so far? :) So the question is what is the interpretation of having three of the lines with a negative slope and only the 40% line with a positive slope? One explanation could be that the relative contribution of precipitation during May and early June is increasing relative to the rest of the year. Rephrasing, more of our yearly precipitation is falling during this time period. Having this period (within first half of the year) as relatively wetter also shifts the yearly distribution to an earlier date, which is likely the cause for the three lines having negative slopes.
Voting:
Good: 100
Bad: 14
Abstain: 7
Tags: precip climatechange

Two hours of precip
05 Nov 2013 05:44 AMRain and even some snow over the northern counties looks very likely today over Iowa. These type of events do not simply rain for an hour and then stop, but persist over a number of hours as the large storm complex passes by. The featured chart presents the frequency of an hour with measurable precipitation for a given month being followed by another hour with measurable precipitation. The lowest frequencies are found during the summer months as thunderstorms tend to be more isolated in nature. The lower values during the winter are likely due to having less intense precipitation events with some hours barely measuring one hundredth of an inch.
Voting:
Good: 51
Bad: 9
Abstain: 5
Tags: precip

Coverage and Amount
01 Nov 2013 05:36 AMSignificant rains fell over the past two days primarily over southeastern Iowa with totals over two inches in areas. The statewide averaged total estimated by the IEM for Wednesday was just over an half inch, but not all of the state saw rain. The featured chart presents the frequency of areal coverage of precipitation to total amount for four months of the year. The colors represent a relative frequency with reds being the most common. You can see the most frequent areas slightly differ by month with July around 15%, April and October around 30% and January a bit more spread out. July is dominated by smaller scale storms than the other month, so their coverage tends to be less. Storms systems are much larger in January, so precipitation tends to be smeared out over larger areas. Rainfall intensities are higher in July. So as the coverage increases, the amount increases as well. This also means that widespread, light rainfall events are not common in July.
Voting:
Good: 123
Bad: 21
Abstain: 15
Tags: precip

Precip Hours
18 Sep 2013 05:39 AMFor places like Des Moines and Ames, it finally rained again yesterday! The Des Moines Airport weather sensor reported measurable rainfall on seven different hours, which exceeded the total to date for all of September and August. The featured chart shows the monthly climatology of number of hours with reported precipitation and this year's total. It is interesting that the climatology for January is about the same as July! Of course the nature of storms for those two months is much different and intensities are much smaller in January. It is raining again this morning in some parts of Iowa and more rain looks to be on the way this week.
Voting:
Good: 69
Bad: 4
Tags: precip

Accumulated Precipitation
06 Sep 2013 05:44 AMWill 2013 be remembered for being a wet year or a dry year or both? The featured chart displays the statewide accumulated precipitation for this year, last year, 1993 (wettest year), and 1988 (driest year). The shading represents the range of values since 1893. Around the end of June, this year was the wettest to date on record, including 1993. The weather since then has been very dry and how the year to date accumulation is approaching merely average with 1993 some 15 inches higher! The forecast continues to hold little hope of widespread precipitation.
Voting:
Good: 146
Bad: 16
Tags: 2013 2012 1993 1988 precip

Making up deficits
05 Jul 2013 05:39 AMThanks to a wet spring and June, Iowa made up its 365 day precipitation deficit from the drought of 2012. The featured chart presents some metrics related to making up this year long precipitation deficit. The top panel displays the daily rate the deficit was made up as measured from the date with the largest deficit to when the deficit was erased. The second panel displays the number of days it took for the given deficit to be erased. The bottom panel displays the depth and time of each period since 1900 with a deficit for statewide precipitation. This year's deficit bottomed out at 9.18 inches on 26 Jan 2013 and was erased on 24 June 2013 (red items on chart). The chart shows that once the long term deficit reaches four or more inches, it will probably take three months or more to recover.
Voting:
Good: 227
Bad: 18
Tags: precip drought
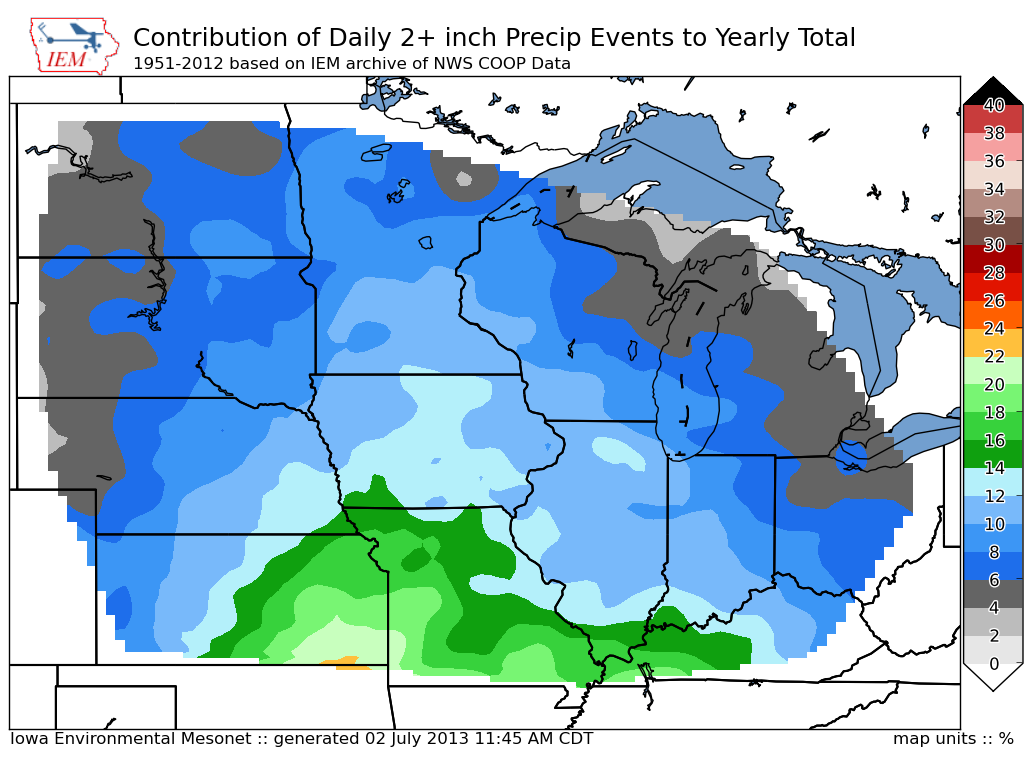
Two inch contributions
03 Jul 2013 05:43 AMThe featured map presents an analysis of the contribution heavy rainfall events have to the overall precipitation total. For this plot, these events are defined as daily precip totals at or above two inches. The map shows the percentage of total precipitation that comes during these events. For Iowa, about 10-15% of the annual precip comes from these intense events. The pattern over the Midwest shows the maximum over southeastern Kansas and minimums over northern Michigan and western North Dakota. The reason being the combination of higher precipitable water (potential for heavy rainfall) the further south (warmer temperatures providing more capacity to hold water vapor) and the favored areas for thunderstorms (clash of air masses providing lift).
Voting:
Good: 71
Bad: 11
Tags: precip

Above Freezing Precipitation
08 Feb 2013 05:37 AMMost of the precipitation that fell on Thursday over Iowa was at temperatures above freezing. Is that rare for the first week of February? The featured chart presents the weekly frequency of hourly precipitation reports from the Des Moines Airport with air temperatures at or above 32°F. A caveat is that frozen precipitation can hit the ground with temperatures slightly above freezing. For the first week of February, the frequency is about 25%. The chances of these mostly rain events dramatically increases by the end of this month with above freezing events becoming the most common in March.
Voting:
Good: 87
Bad: 11
Tags: climate precip

Missing Precipitation
02 Jan 2013 05:35 AMThe featured chart attempts to answer the question of what was missing from the precipitation for Des Moines during 2012. The chart divides up the daily precipitation totals into 5 bins that over the long term have each contributed 20% of the total. For example, the first bin of 0 to 0.29 inches on average provide 20% of the yearly total over an average of 134 days. On the high end, there are an average of 3 events of over 1.51 inches providing another 20%. The red bars are what was observed in 2012 along with the contribution to the departure this year in red text. One category clearly dominates and that was a lack of events between 0.92 and 1.51 inches. While the difference in days at the lowest bin looks significant, the actual departure of total rainfall was marginal.
Voting:
Good: 25
Bad: 3
Tags: precip
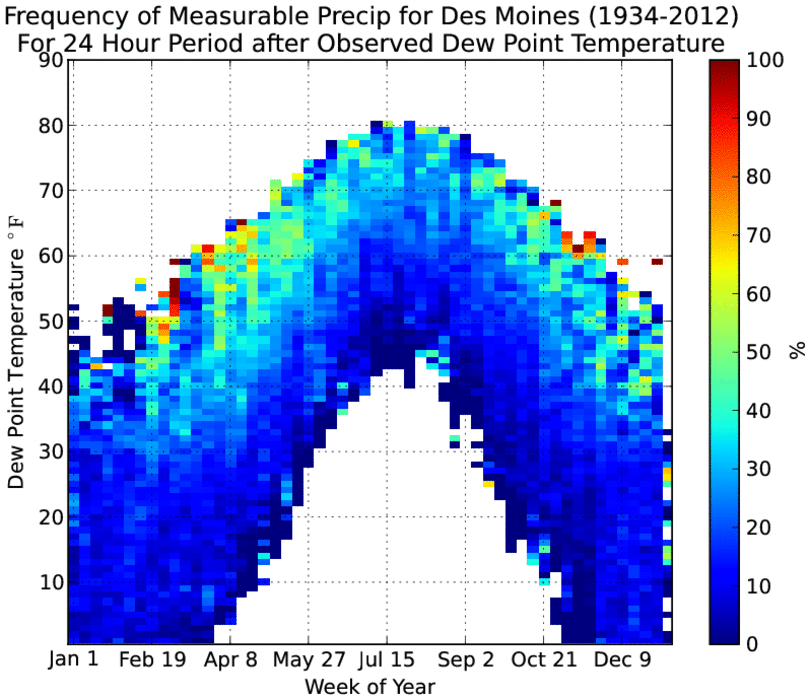
Dew Points then Precipitation
25 Oct 2012 05:00 AMThe very muggy air that has visited Iowa for the past fews days is almost swept clean from the state with the passage of a strong front this morning. It took a bit for showers and thunderstorms to get going Wednesday evening, but the rains did come after sunset. The featured chart looks at the frequency of getting measurable precip for a 24 hour period after a given dew point observation by week of the year. The general pattern is with increased dew points for a given week, the chances of precip increase as well. The highest frequencies are for the spring and fall periods at relatively high dew points for that time of year. These higher dew points are often associated with storm systems that draw moist air from the gulf region northwarn and eventually lead to precipitation, like what is happening today.
Voting:
Good: 27
Bad: 3
Tags: precip dewpoint climate

Do we need severe weather?
06 Jun 2012 05:46 AMThe proverb "you have to take the good with the bad" may apply to rainfall that comes along with thunderstorms in Iowa producing severe weather. How much do these severe thunderstorms contribute to Iowa's total rainfall? The featured chart presents the contribution of yearly rainfall totals for Des Moines during time periods under which the airport was under either a severe thunderstorm or tornado warning, the period including the hour before and after severe weather, and the rest of the year. The +/- hour period does not include the warning period or any other warnings that may have been active at the time. This chart is based on the one minute interval precipitation observations. Based on this data, these thunderstorms generally bring around 10% of the yearly total of precipitation. The severe thunderstorm contribution so far for 2012 is much higher due to an intense storm back on 14 April and the limited data so far this year.
Voting:
Good: 36
Bad: 14
Tags: precip climate
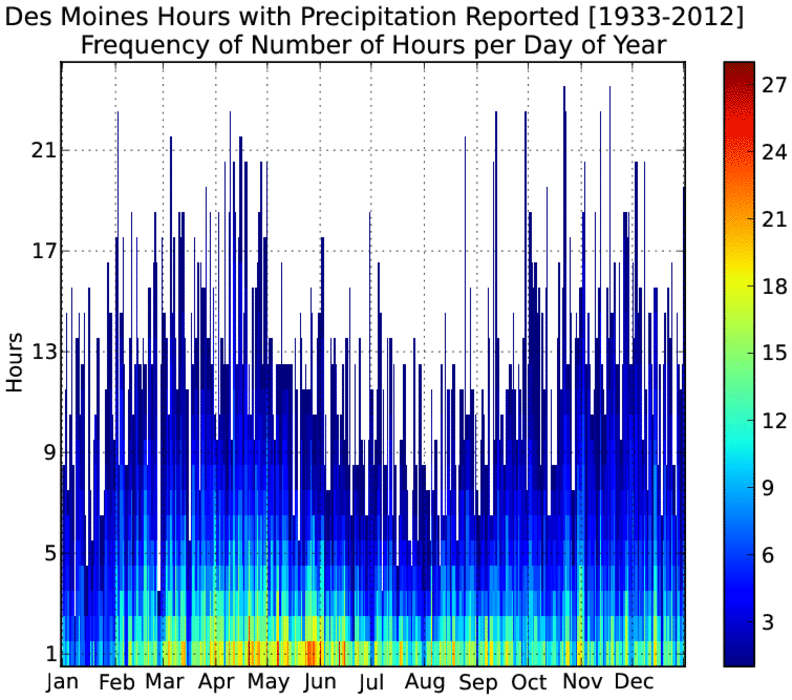
Length of Rain
01 Jun 2012 05:47 AMThe last day of May saw a remarkably cool and drizzly day. The Des Moines ASOS weather sensor reported measurable precipitation for 15 of the 24 hours during the day. The featured chart presents the frequency of hourly reports of precipitation per day of the year based on hourly reports back to 1933. There is a clear signal in this chart showing maximums in precipitation duration in mid spring and late fall. These are common times for large storm systems that could produce precipitation over longer time periods than summer when our weather is dominated by smaller scale storm systems and individual thunderstorms. One caveat to this plot is that our summertime storm systems frequent the state in the late evening into the next morning, so their time totals would be split over two days moreso than other times of the year.
Voting:
Good: 61
Bad: 16
Tags: precip climate

Importance of May
29 May 2012 05:37 AMWith May now winding to a close, it appears this month will come in well below average for most of the state. May is an important month to the yearly contribution of precipitation as shown by the featured chart. The chart shows the frequency of having a month with the same direction of departure as the year long total. For example, having this May be below average precipitation along with having the year of 2012 be below average precipitation. Interestingly, May has the largest frequencies in both directions. Precipitation in May can help "set the table" for the rest of the summer, as a wet May leads to wetter soils and more precipitation chances for the summer. A dry May can have the opposite effect. Most concerning is that this chart would indicate a 75% chance of having below average precipitation for 2012.
Voting:
Good: 33
Bad: 7
Tags: may climate precip

Daily rain chances
31 Oct 2011 05:54 AMDays with rain have been hard to come by the past two months. The featured chart presents the observed daily frequency of measurable rain for the period prior to 1971 and for the period after. October is shown has one of the months with an increased frequency of rainfall, but this year has gone against that trend. Rain is in the forecast to start off November.
Voting:
Good: 13
Bad: 1
Tags: precip

A week of dry weather
12 Sep 2011 05:53 AMThe past seven days have been a dry stretch for most in the state. The featured chart presents the daily frequency of that day being a part of a seven day dry stretch. This chart has a clear annual signal, bottoming out around the first week of June and maximizing in mid December. The forecast looks to keep us dry for another week with high temperatures today around 90!
Voting:
Good: 30
Bad: 14
Tags: precip

Nothing too extreme for Ames yet
17 Aug 2011 05:58 AMPortions of southwest Iowa picked up heavy amounts of rainfall yesterday morning with totals approaching four inches. For Ames, the largest daily rainfall has been 2.65 inches so far this year, which is about average for the largest total of the year. The featured chart presents the largest daily rainfall total each year and the day of the year on which that highest total occurred. The three highest totals all occurred in August. It is also interesting to have the largest totals for some year occur in late February!
Voting:
Good: 13
Bad: 1
Tags: precip

Reliable Rains
08 Aug 2011 08:45 PMGetting timely rainfalls in July and August are critical for corn and soy production in Iowa. Some places in the southern plains have had crop failures this year because of the lack of rain and blistering heat. In Iowa, most places have seen timely rainfalls so far this summer. The featured chart presents the longest period during July and August in between quarter of an inch and half inch rainfalls for Ames. It is remarkable to note the lack of many above long term average periods during the past 20 years. This year looks to continue this trend of not seeing long periods of dry weather.
Voting:
Good: 14
Bad: 3
Tags: precip
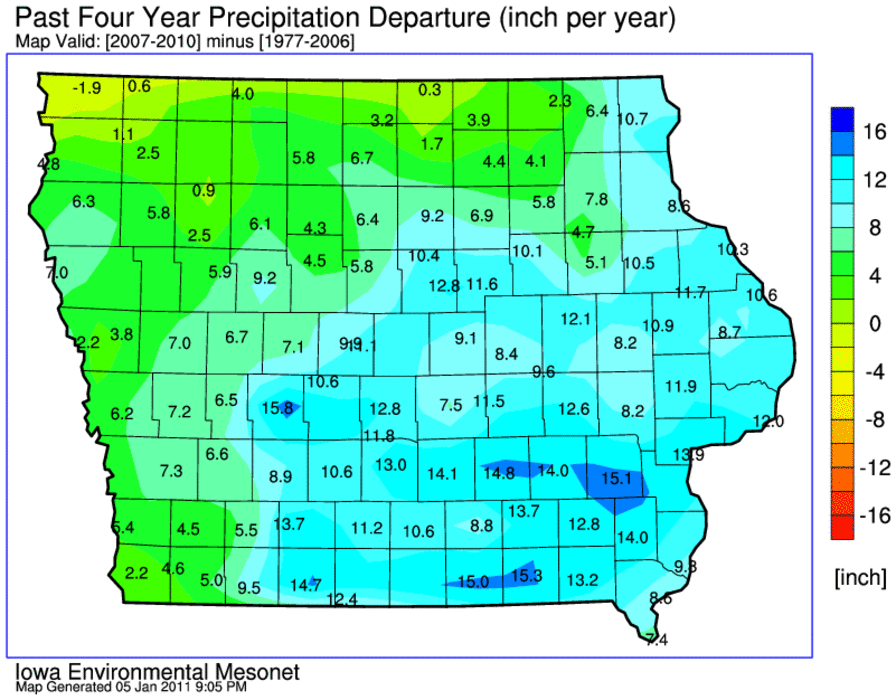
An extra foot
06 Jan 2011 05:51 AMYesterday's feature presented the last four years as being wetter than average statewide. The featured map compares these four years (2007-2010) against the 30 years previous to that. Please note that the units of this chart are inches per year, so a good portion of the state is shown with values in the 10-15 inches range. This means that the past four years have averaged 10-15 inches more per year than the average of the previous 30 years. Some portions of the state have not been as relatively wet and even a deficit appears in far northwestern Iowa.
Voting:
Good: 25
Bad: 2
Tags: precip 2007 2008 2009 2010
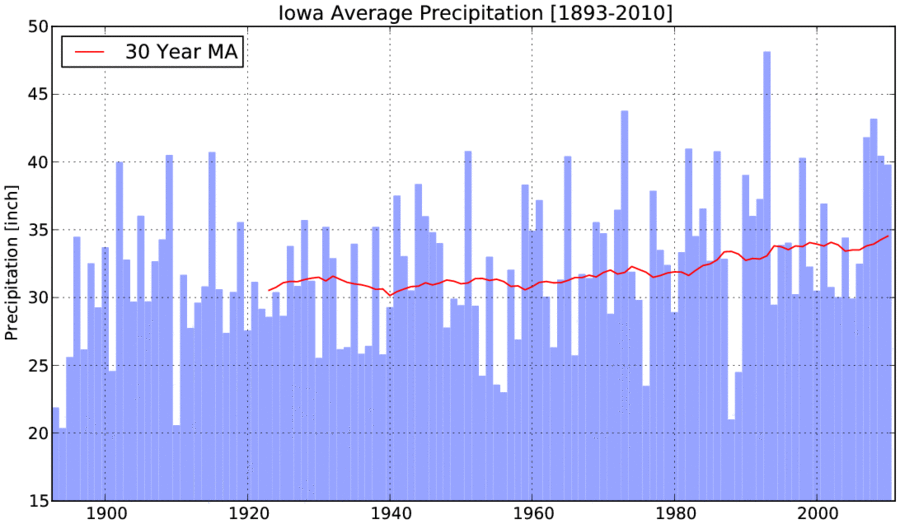
Another wet year
05 Jan 2011 05:46 AMBased on some preliminary data and IEM estimates, 2010 will go down as the four year in a row wetter than a recent trend of 30 years of Iowa data. The featured chart presents the yearly areal averaged precipitation along with a trailing 30 year moving average. The flood year of 1993 and drought year of 1988 stick out in this chart. The trend line has increased in this chart by roughly 4 inches in the past 50 years (~12%).
Voting:
Good: 20
Bad: 5
Tags: climate precip

Cold November Rains
30 Nov 2010 05:47 AMA passing storm system brought rains to primarily eastern Iowa on Monday and with temperatures only in the 40s, it was certainly a cold rain. The featured chart presents the temperature at which the Des Moines ASOS sensor reported an hourly precipitation greater than 5 hundredths of an inch (think of it as the temperature during which the precip fell). The top plot shows that during the summer time, these rain events rarely occur below 60 degrees whereas in late November they occur at 55 degrees and less. Getting stuck outside during a rain is certainly more pleasant in July! The bottom plot shows a comparison between the temperature and reported one hour precipitation total. The bottom plot shows an interesting feature whereby nearly all the heavy one hour events occur at temperatures above 60 degrees. Surface temperatures can be thought of as a proxy to the amount of water capable of being held in a column of atmosphere. To get heavy precipitation rates, one needs a warm column capable of holding more water vapour to yield precipitation.
Voting:
Good: 31
Bad: 5
Tags: climate precip
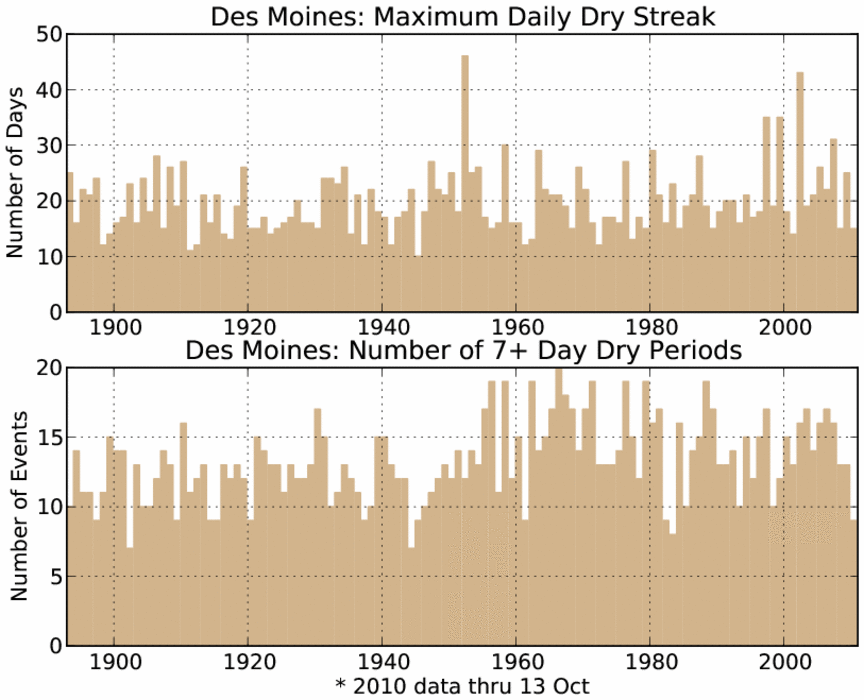
Broke our dry streak
13 Oct 2010 05:47 AMThe streak of dry weather ended for some on Tuesday as showers and thunderstorms visited Iowa again. For Des Moines, the streak was 16 days since the last measurable precipitation event. The featured chart presents the longest dry streak per year since 1893. Each year has seen at least one 10 day period of dry weather with the mean being around 3 weeks long. The bottom chart presents the number of dry streaks that last at least 7 days. The 2010 total is the lowest since 1998, but there are still 2.5 relatively dry months to go this year, so the total will probably be added to.
Voting:
Good: 16
Bad: 4
Tags: precip

Streaks without precipitation
07 Oct 2010 06:53 AMOur remarkable stretch of dry and warm weather continues this October with most locations experiencing no rainfall for the past week or so. The featured chart presents the longest streaks of having little to no precipitation for each day of the year. The lower chart simply presents the maximum daily rainfall. During the summer time, the longest streaks are only 3-4 weeks long, while they can last much longer in the fall and winter time. Our dry weather looks to continue into next week!
Voting:
Good: 19
Bad: 5
Tags: precip

Where to find the wettest weather?
06 Oct 2010 06:58 AMContinuing on the series of features looking at where in Iowa extreme daily weather occurs, this image shows the frequency of a site having the heaviest precipitation for a given day. The plot can be misleading as the smallest percentages are in the middle and increase as one approaches the state border. This pattern shows how some storm systems will clip the state, so locations near the border will pick up the most precipitation while others will receive less. Interestingly, this storm system clipping appears to be the most common to the southeast, where Burlington will get the most.
Voting:
Good: 14
Bad: 6
Tags: precip

Peak intensities
08 Sep 2010 05:55 AMThe featured graph presents IEM computed peak rainfall accumulations measured over an hour and two hours. The values are actual totals from the ASOS precipitation sensor. Just over a week ago, the Ames sensor reported 3.52 inches of rain over a two hour period. This value is only topped on the chart by Spencer back in 2005. You may notice that the two hour total is no where near doubling the one hour total. In Iowa, the heaviest of rainfall events will only last 30 minutes or so. It takes training of multiple cells to produce these large totals.
Voting:
Good: 27
Bad: 7
Tags: 2010 precip

Precip Duration
02 Sep 2010 06:00 AMThe featured chart presents the frequency of precipitation events as measured by the number of consecuative hours at least one hundredth of an inch is reported by the Des Moines weather sensor. Events lasting 10 or more hours are highlighted with the white crosses. The chart shows that long duration events are extremely rare during the summer time when storms tend to be more isolated and not associated with large storm complexes. The largest concentration of long duration events is in March and April.
Voting:
Good: 51
Bad: 16
Tags: climate precip

Foot of rainfall events
27 Jul 2010 06:11 AMHeavy rainfall events have once again been common this July with some locations in northeast and southern Iowa unlucky enough to experience multiple heavy rainfall events. The featured chart presents the number of times per year a NWS COOP site has reported more than 12 inches of rainfall. 1993 shows up very prominently with a total double that of any other year. The 2010 total is only year to date, so perhaps this years total will surpass 2008. Let us hope not!
Voting:
Good: 22
Bad: 3
Tags: precip

A break to end July
26 Jul 2010 06:03 AMThe forecast for this week looks much drier than previous weeks, which is certainly a welcome break. Interestingly, this break coincides with a climatological relative lull in daily precipitation probabilities. The featured chart presents the daily frequency of precipitation reported for Ames with a seven day smooth applied to remove some of the noise. Notice how the end of July has a smaller frequency before the beginning of August.
Voting:
Good: 34
Bad: 2
Tags: precip

More heavy rainfall events to go
23 Jul 2010 05:09 AMThe featured chart presents the number of distinct days per year that at least one NWS COOP site reported over two inches of rain in a 24 hour period. The mean value in this chart is close to 40, which means that we have roughly only seen half of the number of heavy rainfall events for the year so far! The flood year of 1993 shows up as the largest value of 61 days. More heavy rainers are in the state this morning with another round expected tonight into Saturday morning.
Voting:
Good: 70
Bad: 14
Tags: precip

Wet and Dry Months
12 Jul 2010 05:10 AMBased on preliminary data, nearly each of the IEM tracked Iowa climate sites exceeded their average precipitation for June. The featured chart looks at the percentage of these sites that exceed their monthly average since Jan 2007. The chart shows a lot of month to month variability. The April - July period in 2008 sticks out as a period with four months in a row over 80%.
Voting:
Good: 15
Bad: 9
Tags: precip

2+ inch rainfalls
09 Jul 2010 06:11 AMThe featured chart looks at the percentage of long term climate sites that observe a greater than two inch rainfall per year. There are 104 sites in Iowa, that the IEM has precipitation data back to 1951, used for this chart. Based on IEM estimates for 2010, roughly half of these locations have seen a 2+ inch rainfall, which is behind the pace set in the past 3 years. The dots represent the final total for the year with 2007/2008 sticking out as almost every location in the state experiencing a heavy rainfall event. Another take home message of this plot is that more heavy rainfall events will occur as summer is only a few weeks old.
Voting:
Good: 57
Bad: 13
Tags: precip

AM Precipitation
17 Jun 2010 06:12 AMThe featured chart displays the percentage of precipitation that falls between 12 and 8 AM against the rest of the day. The black line is simply the ratio if precipitation fell equally for all hours of the day. The chart shows a clear annual cycle with the largest relative contribution occurring in August. The actual ratios for 2010 are presented as well with 60% of the rainfall so far in June coming in the early morning hours.
Voting:
Good: 40
Bad: 3
Tags: precip
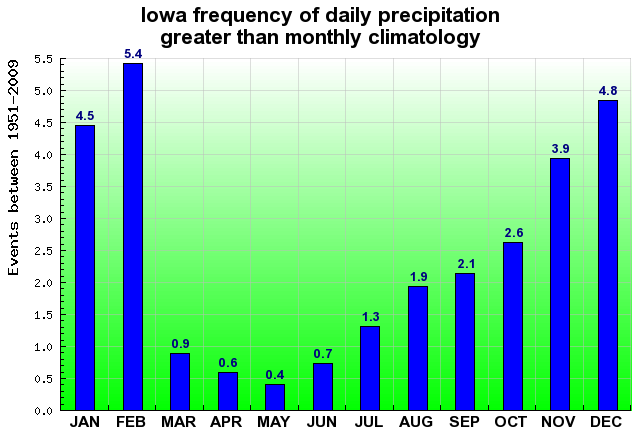
A month's worth in a day
08 Jun 2010 05:09 AMYesterday's feature highlighted the rainfall recorded at Lamoni. The station reported more rainfall in a day than what on average falls during the entire month of June! The featured chart today displays the frequency of a climate site in Iowa picking up more rainfall in a day than what is average for the month. While the chart may seem counter intuitive, monthly precipitation averages during the winter months are much lower and so a bit easier to exceed than the summer months. More heavy rainfall is occurring this morning.
Voting:
Good: 77
Bad: 41
Tags: climate precip
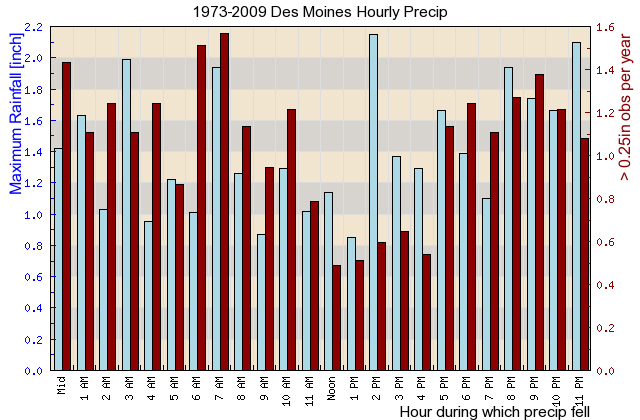
Hourly precip rates
22 Apr 2010 05:11 AMThe featured graph looks at the frequency of hourly precipitation rates over a quarter of an inch (red bars) and the largest amount of precipitation reported during an hour (blue bars) from the Des Moines Airport since 1973. The lowest and less frequent rates occur during the 1 PM hour with maximums in the late afternoon and very early morning around sunrise. The heavy rainfall events tend to occur in the late afternoon forced by peak solar heating and early morning forced by low level jet activity. The middle of the day tends to be a lull in the forcing activity. For Iowa, peak rainfall rates usually do not exceed around 2 inches per hour.
Voting:
Good: 22
Bad: 11
Tags: climate precip
Wettest month
23 Jul 2009 06:08 AMYesterday, the months of the year battled for the being warmer than the others. Today's feature looks at the frequency of having a month being wetter than another. This time there is no clear winner. The summer months are generally wetter, but fall and spring months can top the summer months.
Voting:
Good: 19
Bad: 8
Tags: climate precip
7 days of rainfall v. High
05 Jun 2009 06:06 AMBuilding off of yesterday's feature, today's feature looks at the mean amount of rainfall in three different 7 day periods for a given high temperature in June for all sites in Iowa. For a given day, these 7 day periods are the 7 days prior to the high temperature, the 7 days centered on the high temperature, and the 7 days after. The plot indicates an interesting regime change from when we have highs in the 70s versus highs in the 90s. Notice how in the 70s, the centered and after lines mostly track, while in the 90s the prior and centered lines track. One interuptation would be that when temperatures warm up, more rainfall comes in the forecast and effectively knocks temperatures back down into what is shown in the 70s with more precipitation in the prior period. The overall decrease in precipitation for increasing temperatures is also important (the sun can more effectively warm the ground when it is drier [less precip] ). Rain is in the forecast for this weekend with some strong storms possible.
Voting:
Good: 18
Bad: 12
Tags: climate high precip

Warmth and rain
04 Jun 2009 06:04 AMThe featured graph displays the frequency of rainfall observations a day after a given high temperature for Ames. The three lines are the frequency of given minimum precipitation thresholds. While there are a number of things going on to make this plot appear the way it does, it generally shows that the frequency of rainfall events increases as our temperature increases (more rainfall in the summer). The interesting detail is to note what happens when temperatures reach the 90s. Our chances of rainfall decrease as the temperature gets even warmer. One could speculate that when our temperatures get really warm, the air mass is often drier and soil moisture state is drier as well allowing more efficient warm ups. Rewording, having temperatures in the 90s for Ames is probably associated with a dry weather pattern.
Voting:
Good: 15
Bad: 6
Tags: climate precip highs

One inch rains add up
13 May 2009 06:13 AMThe featured graph shows the contribution of various daily rainfall total amounts to the monthly average for Ames. The red portion of the bar chart represents when an inch plus of rain falls. If you were to eliminate the red (stop daily rainfalls over an inch) portion of this chart, our wettest month would only see a bit over 2 inches of rain. Another interesting part of this graph is this insignificance of less than 0.05 inch rainfalls to the overall totals (can not see the blues). Heavy rainfall is currently occuring in Iowa today with some locations definitely picking up more than an inch.
Voting:
Good: 21
Bad: 6
Tags: climate precip

When does it rain?
14 Nov 2008 06:20 AMThe featured chart shows the hourly frequency of rainfall observations based on observations from the Des Moines Airport since 1973. The units of this chart are average number of hourly observations per month per year for that hour. Confused? For example, the red square represents a number around 4. This means that during the month of May, approximately 4 days during May have rainfall reported during the 7 oclock hour, which is the rainiest time of the year. According to this plot, the driest time is roughly 5 PM in August. There are many other interesting things in this plot. Compare October and November versus July and August. During the summer, rainfall comes during the nighttime. During the fall, it mostly comes during the afternoon.
Voting:
Good: 42
Bad: 24
Tags: climate precip
Rainy days increasing
12 Sep 2008 06:23 AMThe featured chart is the number of days with measurable precip per year for the long term climate sites. This chart would indicate that the number of rainy days is increasing at a rate of roughly 1 day per 5 years. 2008 will continue this trend with more rainy days in the forecast today and this weekend.
Voting:
Good: 41
Bad: 14
Tags: precip climate
It should be a wet month
13 Jun 2007 07:00 AMThe featured bar chart is of monthly precipitation climatology for Ames. The blue bars are the average monthly accumulation and red bars are the average number of days during the month which have measurable precip. So for June, we average roughly 5 inches of rainfall spread over 10 days. In other words, we average 0.50 inches of rain every 3 days. Our recent weather for this month has been rather dry thanks to slow moving ridge that has kept the rainfall west of the state.
Voting:
Good: 12
Bad: 3
Tags: climate precip
Hourly rainfall
12 Jun 2007 07:20 AMThe featured graph is the distribution of hourly rainfall observations from the Des Moines Airport for the month of June (red) and for the year (blue) since 1973. The graph shows two clear modes for rainfall in Iowa. The first being around 6 AM due to the night time thunderstorm complexes feed by the low level jet in the summertime. The second being around 7 PM due to storms fueled by the heating of the day. In general, the night time is clearly the rainiest period during June with the other summer months showing a similiar distribution.
Voting:
Good: 13
Bad: 3
Tags: climate precip