Past IEM Features tagged: highs

Time above Daily Average
03 Mar 2020 05:35 AMThe featured chart is perhaps a neither here nor there climatology of how much time is spent each day with the air temperature above the same given day's simple average based on the high and low temperature. If the daily heating and cooling rates were equal, we would expect to spend 12 hours total on each side of average. Actual weather, time of year, and surface cover often dictates otherwise. The chart partitions the data by month of the year and presents it in a "violin" type plot which provides a comparable density estimate. The white dots are the monthly means. There are a number of interesting climatological aspects to the chart including increased frequency above 12 hours for most months except August, September, and October. The reason perhaps being asymmetric heating vs cooling rates with ever shortening daylight hours.
Voting:
Good: 9
Bad: 1
Abstain: 2
Tags: 1minute highs

Rule of 43
14 Feb 2018 05:33 AMHigh temperatures are expected to soar to levels of warmth you should express to your significant other today. But how warm can it get with deep snow cover existing over much of the state? A local forecasting rule of thumb is to not forecast a high temperature over 43 degrees when there is at least four inches of snow depth to start the day. Does this rule hold against long term observations? With a bunch of caveats with how daily snow depth and high temperatures are reported, the featured chart depicts binned box plots for a given snow depth and the following day high temperature. So in general this rule mostly holds, but there are a few observations shown above the 43 degrees and four inch depth. Of course, the reason for this rule is energy is consumed by melting available snow that would otherwise go into heating the air.
Voting:
Good: 13
Bad: 0
Tags: snowcover highs forecasting

Day to Day High Change
19 Oct 2017 05:35 AMTemperatures warmed a bit more on Wednesday with highs well into the 70s for much of the state. For the day to day change in high temperature, having a warmer temperature has been the most common this month as shown by the featured chart. The chart shows the overall monthly averages and those for 2017 for the day to day change in high temperature for Des Moines. A number of months this year have seen more than average number of days with the high temperature warmer than the previous day.
Voting:
Good: 7
Bad: 0
Tags: highs

Many warm, few very hot days
19 Sep 2017 05:33 AMThe featured chart looks at the number of days this year with the daily high temperature at or above a given threshold. The blue bars and labels represent the largest number of days and year at that level. For Des Moines, 2017 has seen plenty of warm days with values in the 70 to 80 degree range rather close to the largest values on record. But for warmer temperatures at 85 degrees and higher, this year has not even been close to previous warmest years. The forecast does have us adding days at these warmer temperatures for the rest of the week and even some low 90s are possible!
Voting:
Good: 7
Bad: 1
Tags: highs

Fourth 90+
06 Jun 2017 05:33 AMThe Des Moines Airport reached 90+ degrees for a high temperature on Monday for the fourth time this year. The featured chart looks at the number of days with a high temperature in the given range for this year, last year, and on average for the year to date period. The four days this year is well above the average of 1 and there were none this far during 2016. The chart also shows the same metrics for other ranges of high temperatures. For the 70s, we are 50% higher than average with 30 days this year vs the long term average of 20!
Voting:
Good: 7
Bad: 1
Abstain: 1
Tags: highs

Early for 70
29 Feb 2016 05:35 AMHaving the temperature reach 70 degrees in February is a rare feat as was done by Des Moines on Saturday reaching 71 degrees. This was the third warmest temperature this early on record! The featured chart displays the number of days per year with the high temperature above 70 degrees for Des Moines and the first such occurrence for the year. The chart only shows that the average first date is just under a month from now, so we are well ahead of schedule this year! The chart also shows a large number of years that did not reach 70+ until April and even late into April!
Voting:
Good: 28
Bad: 21
Abstain: 17
Tags: highs
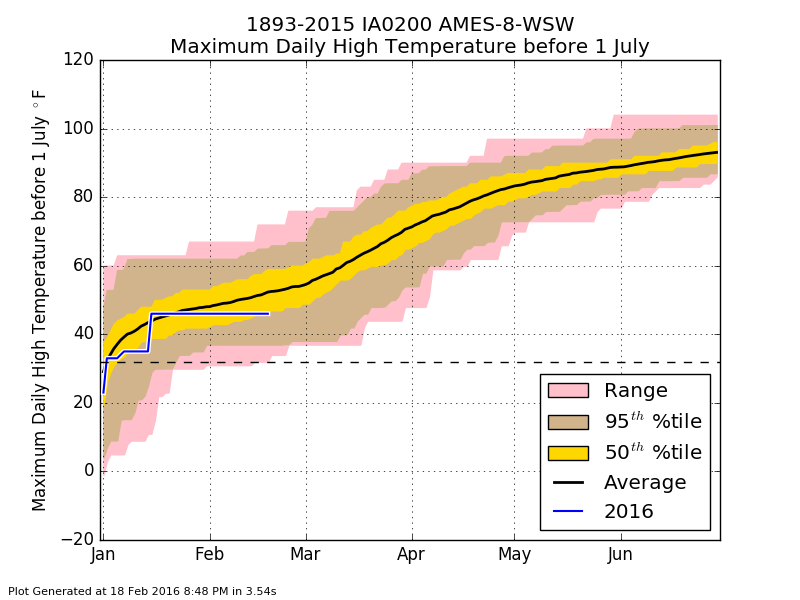
To date maximums
19 Feb 2016 05:36 AMTemperatures warmed nicely on Thursday, with some locations experiencing their warmest temperature so far this year. The featured chart displays the distribution of year to date warmest daily high temperature for Ames. The blue line represents the period to date this year with our warmest temperature on the cool side of long term average. The slope of the average curve really steepens into March as springtime and warmer weather becomes more established than in February. Today (Friday) will feel more like spring with highs even warmer than Thursday.
Voting:
Good: 45
Bad: 35
Abstain: 28
Tags: spring highs

Above Average Days
25 Sep 2015 05:38 AMHigh temperatures this month have mostly been above each day's average high. The featured chart displays the percentage of days each year for the year to date period that the daily high temperature was above average. This year has continued a recent trend of having fewer than 50% of the days below average. The notable exception being 2012.
Voting:
Good: 26
Bad: 28
Abstain: 15
Tags: highs
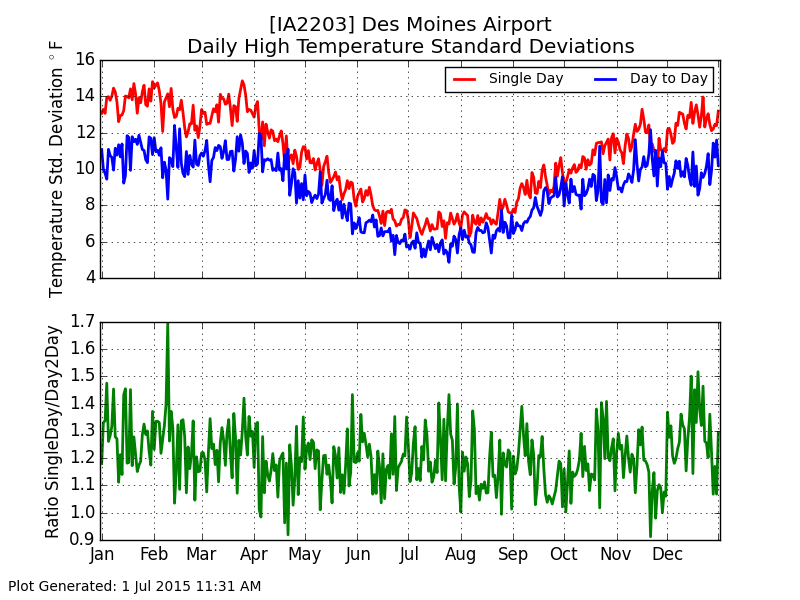
Daily Variability
02 Jul 2015 05:44 AMThe featured chart displays the daily high temperature standard deviation for Des Moines for two variables. The first being the spread of highs for a given day and the second being the spread of day to day changes in high temperature. The lower chart presents the ratio between these two values. July shows the least variability for both parameters as warm soils and elevated humidities help to regulate temperatures. The chart shows that the day to day variability is lower than the long term variability for that day. This makes sense as the long term distribution of temps creates a bounds for the day to day variability and also there is a bit of memory in the day to day temperatures, so the daily high temperature yesterday has a higher influence than the high temperature for the previous year for that date.
Voting:
Good: 10
Bad: 8
Abstain: 3
Tags: highs

Close to Average
24 Jun 2015 05:32 AMHigh temperatures on Tuesday were close to average for much of the state, which is typical for this time of year as shown by the featured chart. The chart displays the percentage of years that the high or low temperature is within five degrees of the NCDC climatology for the location, in this case Ames. The summer months are generally above the 50% value, which means that for a majority of the time the high or low temperature is within five degrees of average. This is thanks to warm ground temperatures and elevated humidity levels that help dampen most wild swings in temperature.
Voting:
Good: 17
Bad: 7
Abstain: 10
Tags: highs lows

Period between Temps
10 Jun 2015 05:45 AMThe warmest day of the year by far was yesterday with high temperatures soaring into the 90s. This was the warmest weather we have seen since last September. The featured chart displays the period for Ames between the average last date for a high temperature at or above a given threshold to the average first date of the year. The right hand side chart is simply the number of days represented by the bars. The change in slope of the plot on the right hand side is interesting and it is not clear exactly what it is illustrating, but as you get to very warm temperatures, the annual influence on the period decreases as the average period increases to a full year's period.
Voting:
Good: 18
Bad: 10
Abstain: 7
Tags: highs

First High Temperatures
08 May 2014 05:39 AMDes Moines hit 90 degrees for the first time this year on Tuesday. This was about four weeks earlier than long term average. The featured chart presents the average first date of the year for a given high temperature and the dates for just 2014. For some temperature thresholds, this year was earlier than average and for others later. Temperatures on Thursday will be cooler with chances of thunderstorms, some of them being severe.
Voting:
Good: 23
Bad: 4
Abstain: 5
Tags: highs

Smashing Record Lows
03 Mar 2014 08:42 AMThe Waterloo Airport reported a low temperature of -19 degrees this morning, which beat the previous record by 13 degrees! The featured chart presents the amount a newly set daily record temperature beat the previous record-to-date for that day for Waterloo. A thirteen degree beat for low temperature was the largest departure since 5 Dec 2005. Some of the extreme beats are labelled on this chart and you'll notice most of the dates are in the winter and spring months. Temperatures are more constrained in the summer time thanks to soil temperatures and atmospheric humidity, so it is much more difficult to get large beats of records during those months.
Voting:
Good: 36
Bad: 6
Abstain: 4
Tags: highs lows records

Getting to 50
13 Jan 2014 04:54 AMIt felt quite balmy on Sunday as high temperatures were above freezing and much warmer than our previous few weeks of weather. The high temperature for Des Moines hit 51, which was only seven days after having a high of -1. The featured chart presents the average number of days it takes to reach a high temperature of 50+ after a day with the given high temperature. The regression would indicate that the average time it takes for this to occur is around 30 days!
Voting:
Good: 30
Bad: 6
Abstain: 4
Tags: highs

Big Jump Up
18 Dec 2013 05:37 AMAfter a very cold stretch of weather, temperatures warmed nicely on Tuesday into the 30s and are expected to reach the 40s for much of Iowa on Wednesday. Today's high is expected to be ten degrees warmer for Des Moines than the warmest high over the past thirteen days. The featured chart presents the largest increase in daily high temperature for a day vs the maximum over the previous thirteen days. The largest change shown occurred on 14 Feb 1899 with a high of 47 after a previous thirteen day high of 17. The chart shows a clear annual signal as these types of events are favored in the late spring as warm air mass surges replace persistent cold air masses probably associated with a snow pack.
Voting:
Good: 32
Bad: 5
Abstain: 3
Tags: highs

Common Temperature Rise
28 Oct 2013 05:36 AMAfter a very chilly start, temperatures warmed nicely in Iowa on Sunday with some places, like Ames, having a 40 degree warmer high than low temperature. The featured chart displays box and whisker plots for the daily temperature rise partitioned by month of the year. Having a 40 degree rise in October is not uncommon, but would be very rare in the mid summer. The box shows the 25th to 75th percentile of the data (half the observations) and the whiskers show the 5th and 95th percentile. It will be a bit before another very nice day like Sunday as wet weather is expected for much of the coming week.
Voting:
Good: 37
Bad: 8
Abstain: 6
Tags: highs lows

104 on Aug 30th
03 Sep 2013 05:27 AMOur recent stretch of hot weather has thankfully come to an end. Des Moines topped out at 104 degrees on Friday, which was the warmest temperature on record this late in the year. The featured chart displays the latest date of the year for a given high temperature. The 104 for Des Moines set the latest date for the 104, 103, and 102 temperature levels. The year of the temperature record is shown as well. Temperatures are expected back into the 90s next week with next to zero chances of precipitation.
Voting:
Good: 68
Bad: 4
Tags: 2013 highs

3 straight with 99
29 Aug 2013 05:40 AMThe high temperature for Des Moines has reached 99 for each of the past three days. This ties the longest streak of 99 for the site set in July 1916. The featured chart presents the longest streak of consecutive days at a given high temperature. Five days is the maximum for any temperature. Hitting 99 again today is possible, but it would appear the temperature will fall short of it by a few degrees.
Voting:
Good: 61
Bad: 7
Tags: highs
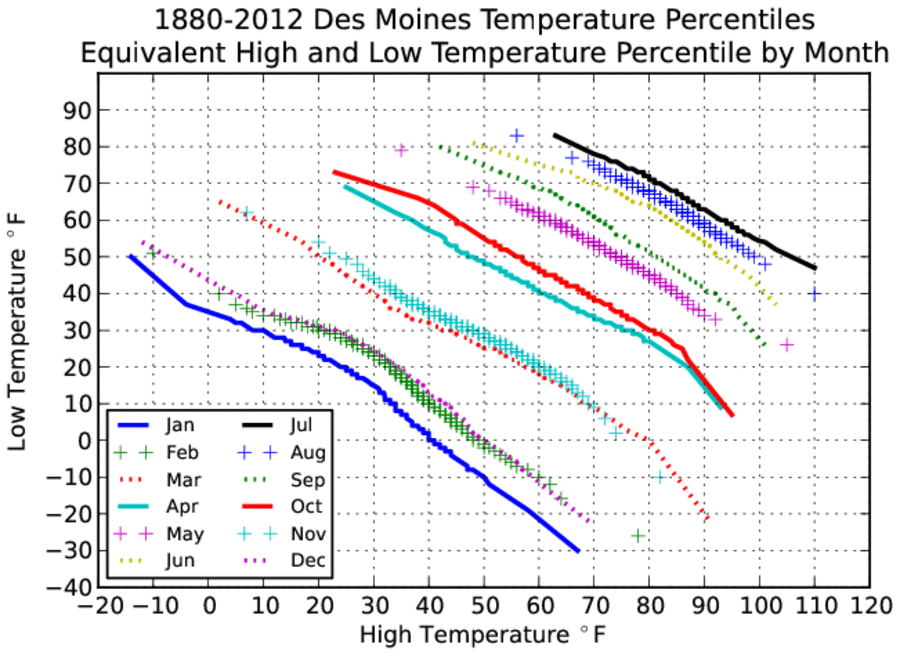
High + Low Percentiles
28 Jul 2013 07:46 AMThe low temperature dipped to 51 degrees for Des Moines on Sunday morning, which set a record low temperature. How common is this cold of a temperature in July? The featured chart presents a means by which low temperature frequencies can be compared to high temperature frequencies by equating their respective percentiles. A line is shown for each month of the year. So for July, the 51 degree low temperature compares with a high temperature around 104. Restating, Des Moines has about the same number of days at or below 51 degrees for a low temperature as it does for having a high temperature at or above 104. So you could say the weather this morning is as common as a high of 104!
Voting:
Good: 118
Bad: 13
Tags: qq climate highs lows

Daily Changes
12 Feb 2013 05:42 AMOur daylight time gets longer and the sun gets higher in the sky each day in February, but does that make a difference for our day to day high temperature. The featured chart shows the frequency of day to day high temperature changes by month for Ames. While there is a clear annual signal, the magnitude of the cycle is not that large. The annual climatology of temperature is only a gentle tug on day to day changes. Our daily temperatures are dominated by weather systems and the translation of air masses over the state. Our highs this week will creep a bit higher and then be cooler to end the week.
Voting:
Good: 30
Bad: 4
Tags: highs
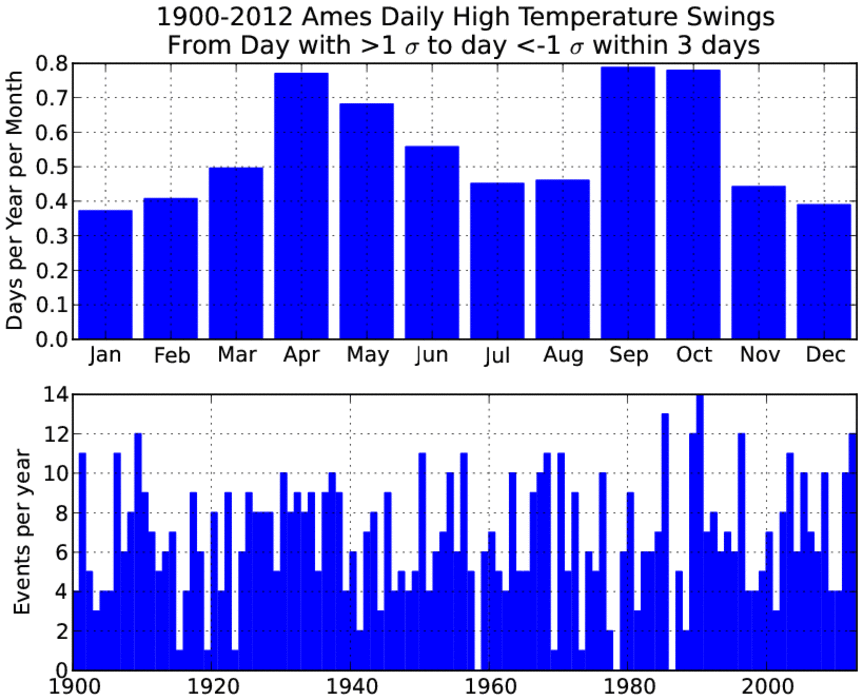
Sigma Swings
21 Jan 2013 05:51 AMTemperatures warmed nicely on Saturday into the 50s, placing us over a standard deviation from average for the date (called sigma). Temperatures have since crashed and will struggle in the single digits today, which less than negative one sigma from average. The featured chart looks at how often this change of going from at least a positive one sigma high temperature to lower than a negative one within three days. The top chart shows that January is the least frequent month for this event as warm air surges are the least common. The bottom chart presents the yearly total of these events and last year saw the second most at 12 days.
Voting:
Good: 16
Bad: 5
Tags: sigma highs

Day Two Dives
06 Dec 2012 05:35 AMAfter setting a record high temperature on Monday of 69 degrees, the high on Wednesday for Des Moines was only 46 degrees (still above average though) making for a 23 degree change over the two days. Is this typical? The featured chart presents the monthly distribution of two day high temperature change after a day of setting or tieing the record high. While actual data goes back to the late 1800s, the period up until 1930 was used as a "warm up" for this chart. The box plots used on the chart show the median (red line), 25th and 75th percentiles (box bounds) and the whiskers represent the 2nd and 98th percentiles. For December, the current change of 23 degrees is only slightly lower than the long term median, so it is about what we would expect. Postive values on this chart would indicate the day two temperature was warmer than the record setting temperature. This situation appears to be the most common in July as record warmth tends to provide conditions for more record warmth. In the winter season, record warmth is from a displaced air mass that is often replaced by a colder air mass with the passage of a storm system.
Voting:
Good: 29
Bad: 9
Tags: records highs
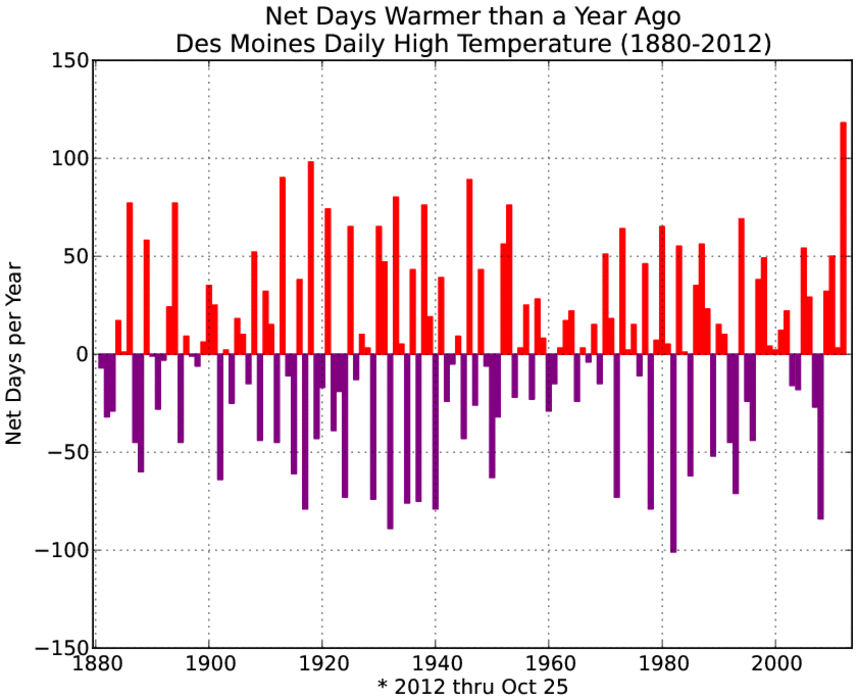
Warmer days than last year
26 Oct 2012 05:42 AMThis year has seen many very warm days. When compared with the same day for 2011 for Des Moines, this year has had 117 net more warmer days for high temperature! This total dwarfs all previous years on record and interestingly makes for the fourth straight year for more net warmer days than the previous year. Even if you compare this year with previous years for the same period up until 26 October, it is still well ahead of any previous year. This total does look to go down slightly in the coming days as much colder air has arrived and even some snow over northwestern Iowa on Thursday afternoon!
Voting:
Good: 43
Bad: 12
Tags: highs
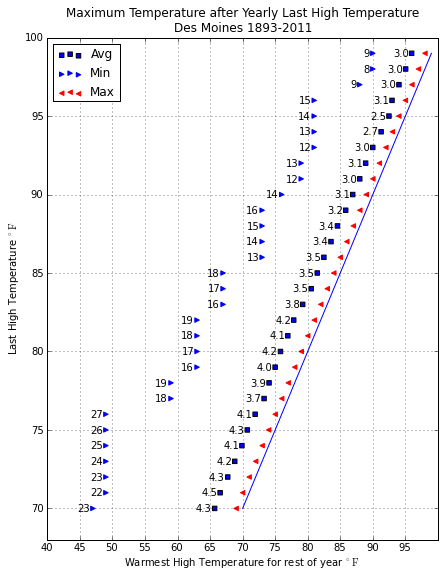
Maximum after last Maximum
17 Sep 2012 05:38 AMThis weekend saw very pleasant temperatures with highs in the upper 70s and 80s. A cold front is set to bring a regime change to our weather today. Will this be the last we see of the 80s? The featured chart looks at the warmest high temperature after having a high temperature at or above a given threshold for the period including the rest of the calendar year. The maximum, average, and minimum of these yearly values is presented. The point of the chart is that typically these temperature step-downs in the fall happen in about 3-5 degree increments. The minimum values show that some years can see dramatic changes with highs in the low 70s and then not broaching 50 degrees for the rest of the year. These events happen much later in the year than September.
Voting:
Good: 29
Bad: 10
Tags: highs

Days above X
12 Sep 2012 05:17 AMTuesday was yet another very warm day in Iowa with highs pushing 90 degrees for much of the state. For Des Moines, Tuesday tied the previous record for most days with high temperature at or above 82 and 83 degrees. The featured chart presents the maximum number of days per year at or above a given temperature threshold. The current maximum number of days is shown in gold and the 2012 total so far is shown in cardinal (Go Cyclones!). High temperatures today will come close to breaking the tie at the 82 and 83 thresholds. Keep in mind that we still have 3.5 months left to potentially break some of these other thresholds.
Voting:
Good: 38
Bad: 9
Tags: highs 2012

Two days of 96+
31 Aug 2012 04:49 AMThursday was the second of two very warm days for late August in Iowa. Des Moines hit 97 after reaching 96 on Wednesday. This is latest date for two straight days with such a warm temperature since 1990. The featured chart presents the latest date for having two days at or above a given high temperature threshold. For example, having two days at or above 90 has happened as late as the first week of October. While Friday will be slightly cooler, we will stay above average until the middle of next week.
Voting:
Good: 128
Bad: 23
Tags: highs

Hot Three Days
07 Jul 2012 05:58 AMThe high temperature reached the century mark at Des Moines for the third straight day on Friday. The featured chart presents the warmest three day period (in terms of average high temperature) each year since 1880. The last year to have a three day period average over 100 degrees was 1988. The two warmest years in this chart were during the 1930s (1934 and 1936). The good news is the oppressive heat is being pushed out of the state on Saturday and highs are expected back in the 80s next week.
Voting:
Good: 66
Bad: 10
Tags: 2012 highs
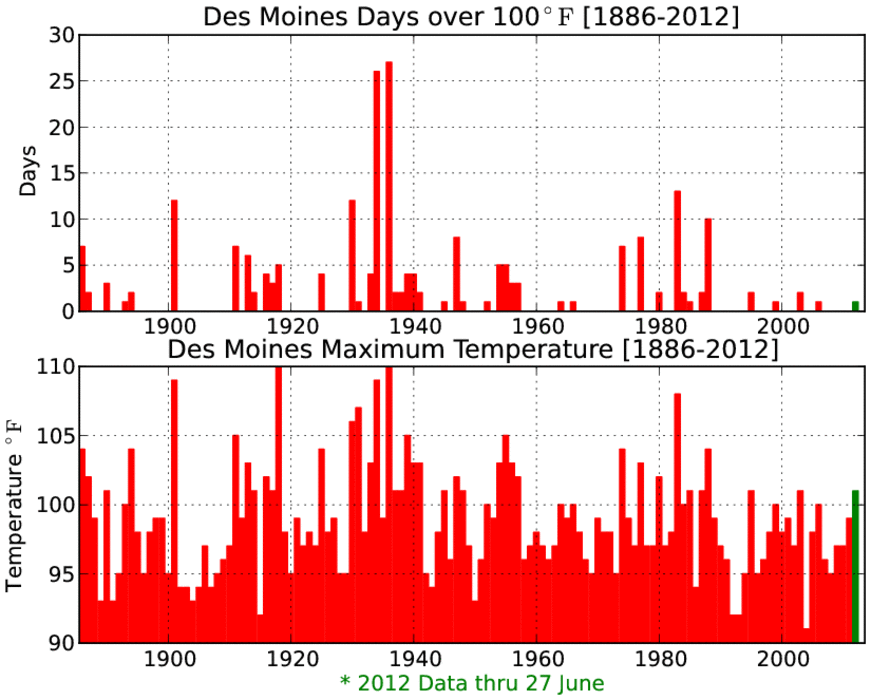
101
28 Jun 2012 05:53 AMThe high temperature for Des Moines hit 101 degrees yesterday, making for the first 100 degree reading since 2006. The featured chart presents the number of days each year the temperature was in triple digits and the highest temperature for that year. The 1980s were the last period of a significant number of these really warm days. Of course, the dust bowl period of the 1930s stand out on this plot as well.
Voting:
Good: 30
Bad: 4
Tags: highs

26 days and counting
05 Apr 2012 05:52 AMOur remarkable stretch of warm weather continues to set interesting records. The featured chart shows the daily high and low temperature departure from average for Des Moines since the first of March. The past 26 days have seen a high temperature ten or more degrees above average. This is easily the longest streak on record for the site and bests the previous longest streak of 17 days back in Jan-Feb of 1931. Much cooler overnight low temperatures are set to arrive this evening with chances of sub freezing temperatures over the northeastern half of the state.
Voting:
Good: 23
Bad: 5
Tags: 2012 highs

In-state correlations
04 Apr 2012 05:57 AMThe past few days have seen some remarkable differences in high temperature over Iowa. The featured chart presents the daily high temperature correlation coefficient between a handful of sites in the state. A value of one indicates a positive correlation, but not necessarily that their daily high temperatures are equal. A short physical distance comparison is shown for Ames versus Des Moines to compare against the cross-state pairs. In all cases, the lowest correlations are during the summertime as high temperatures are often guided by the effects of clouds and rain from small scale processes. Looking SW to NE or SE to NW over the state does not appear to yield a significant difference in this crude comparison.
Voting:
Good: 24
Bad: 7
Tags: highs

Breaking record by a month
18 Mar 2012 12:06 PMOur epic stretch of March warm continues with temperatures expected to approach 80 degrees again today. Des Moines has hit 80 degrees each of the past four days making for the earliest streak of such warm weather. It was not only the earliest streak, but bested the previous record by a month! The featured chart presents the earliest four day streak of a given temperature threshold for Des Moines. The green line was the record prior to this year. The previous record for 80+ degree days was in mid April!
Voting:
Good: 21
Bad: 8
Tags: highs mar12

Three days of 60+
02 Feb 2012 05:49 AMWednesday was yet another amazingly warm day in winter for most folks in Iowa. Des Moines hit 60 degrees for the third day in a row. The weather bureau noted that this was the first three day stretch of 60 degrees for Des Moines during the period of 15 Dec to 15 Feb on record! The featured chart presents the warmest three day streak of weather based on the minimum high temperature during that period. The first day of the streak is used to place the three day value for a month. Our most recent streak would be the warmest for January besting the previous streak in 2002 of 59.
Voting:
Good: 11
Bad: 4
Tags: 2012 highs
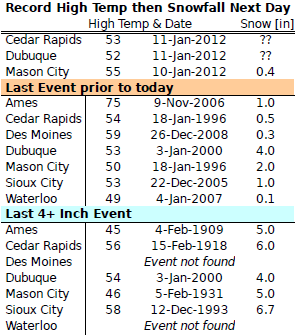
Records highs then snow
12 Jan 2012 05:49 AMOur remarkable stretch of warm January weather came to an abrupt end on Wednesday thanks to a very strong cold front plowing through the state bringing some snow along with it. The high temperatures, before the front passed through, hit record levels over portions of eastern Iowa and with snow falling today, creates the unique situation of having a record high temperature followed by snow the next day. The featured chart presents an IEM computed analysis of the most recent occurrence of having snowfall on the day after a record high temperature for some long term sites in the state. There are caveats galore with this data due to issues with snowfall data quality and the nature of daily climate observation times being at 7 AM (long story). Heavier snowfall totals are expected over eastern Iowa, so the bottom portion of the chart presents the most recent occurrence where the snowfall was four inches or more. In general, these events are rare and getting heavy snowfall is even more rare. Note: the record high temperature was computed up until that date since the beginning of the record.
Voting:
Good: 33
Bad: 6
Tags: jan12 snow highs

50 degrees in December
30 Dec 2011 05:55 AMHigh temperatures on Thursday were almost too good to be true around 50 degrees. How exceptional is it to have 50 degree temperatures in December? The featured chart presents the daily 95th percentile for high temperature (which ~50 in December approximately falls). Using this metric, we can see that our current weather is about equivalent to having 100 degree temperatures in July. The bottom chart shows the distance, as normalized by the day's standard deviation, the 95th percentile is from the daily average.
Voting:
Good: 32
Bad: 7
Tags: highs
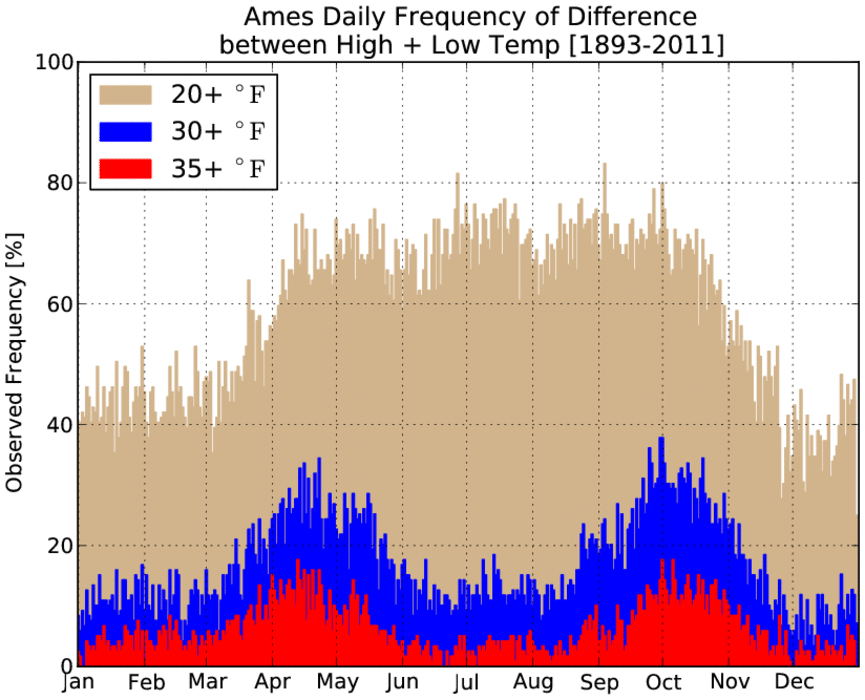
Big Warmup for late November
01 Dec 2011 05:58 AMTemperatures yesterday warmed 37 degrees for Ames after a chilly start in the low teens. Having this large of a daily warm up is somewhat rare for this time of year as shown by the featured chart. The chart presents the frequency of 20+, 30+, and 35+ degree differences between the daily low and high temperature. The spring and fall seasons show up clearly in this chart along with a general annual signal of the 20 degree line. The dip in frequencies for the largest differences in the summer is due to shorter nighttime periods (less time to cool off) and abundance of water vapor to help moderate any temperature moves.
Voting:
Good: 16
Bad: 3
Tags: climate highs

Warmest at midnight
02 Nov 2011 05:58 AMAfter high temperatures soared into the 70s on Tuesday, they will struggle to do any raising at all today with some locations expected to set their daily high temperature at midnight this morning. The featured chart looks at the frequency of having the warmest temperature of the day occur during the midnight hour for Des Moines. For November, these frequencies equate to roughly 4-5 days per year.
Voting:
Good: 13
Bad: 3
Tags: highs

Wednesday Drop
27 Oct 2011 05:35 AMThe high temperature on Wednesday was more than 20 degrees colder than the high on Tueday making for the largest one day drop in temperature for Ames since early June. The featured chart presents the day to day changes in high temperature for this year along with the daily maximum and minimum value since 1893. Day to day variability is much less in the summer time thanks to the moderating effects of water vapor in the air, warm ground temperatures, and more direct solar angle.
Voting:
Good: 11
Bad: 4
Tags: highs
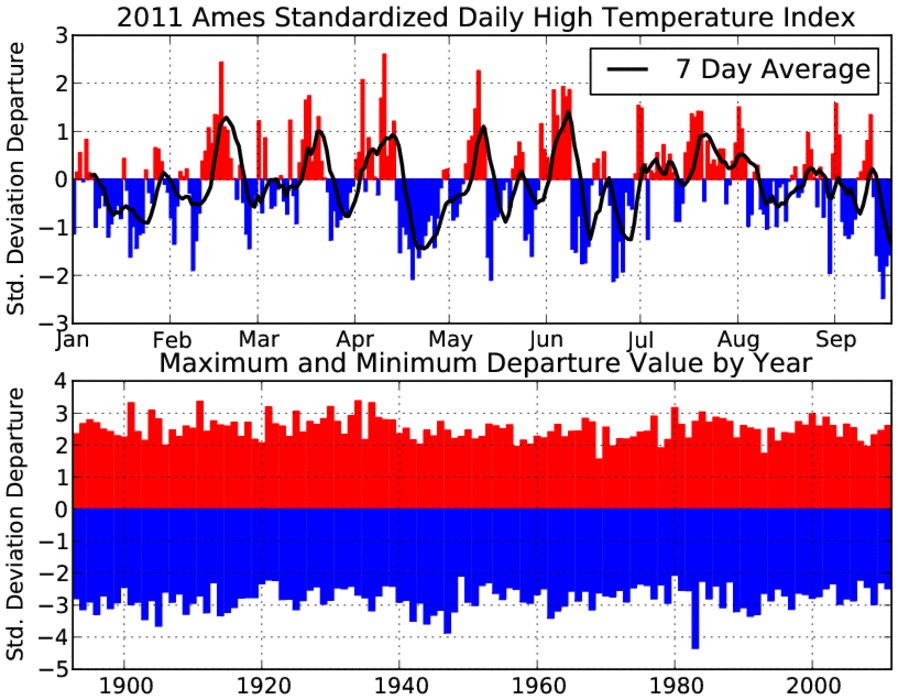
Relatively coldest all year
21 Sep 2011 05:57 AMOur recent stretch of cool high temperatures was far from where we should be this time of year. One way to measure the distance a temperature is from the average value is to normalize it by the standard deviation for all temperature reports for that day in history. A value of positive two would mean the temperature is two standard deviations warmer than average. By standardizing, we can compare temperatures at most any time of the year. Indeed, the lowest values on the upper air occurred with our recent cool stretch! The bottom chart simply shows the largest and smallest index value per year. The sore thumb in the chart is the -4.3 on December 24, 1983. High temperatures that day were in the negative teens!
Voting:
Good: 12
Bad: 3
Tags: highs
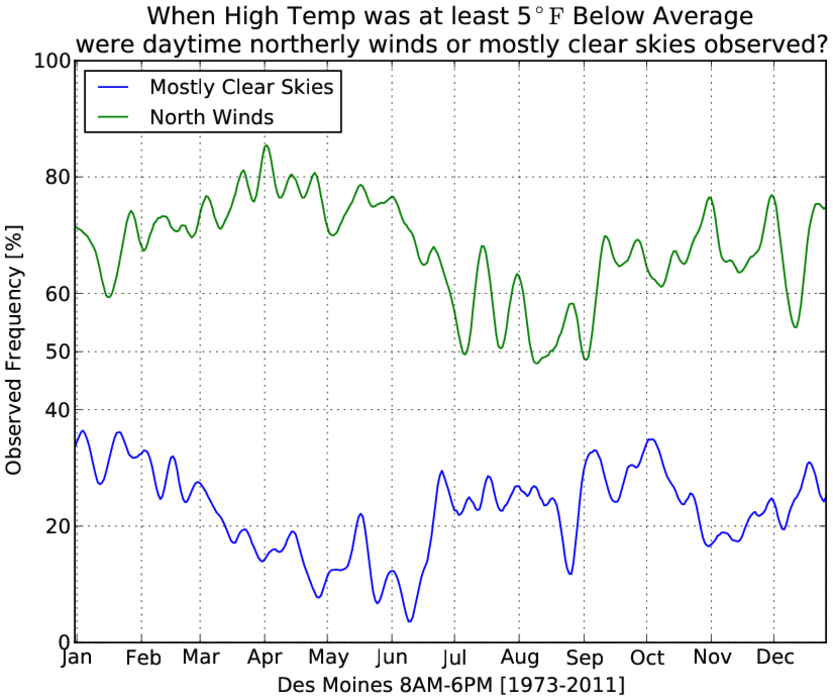
Cool days and clear skies
08 Sep 2011 05:50 AMThe weather these past few days has been remarkable for cool high temperatures along with mostly clear skies overhead. The featured chart attempts to look at the relationship of having cool days along with mostly clear skies or northerly winds. While the determination of these two criteria was somewhat arbitrary, the signal appears to be reasonable. Having northerly winds is common for these cool days, but least important during the summer time when the air to our north may not be that cold. Clear skies are the least common during May and June, when are surface heating rates are the largest.
Voting:
Good: 8
Bad: 5
Tags: climate clouds highs

Warmer weather to come?
28 Jun 2011 05:54 AMThe featured chart presents the frequency of a given day being one of the seven warmest for the year. July is clearly the winner with most days having an one in ten chance of being one of the seven warmest for the year. The red bars indicate the warmest seven days so far this year and given that these days fall outside of the higher probabilities, perhaps we can expect warm days ahead in July with highs well into the 90s? The forecast has highs above 90 on Thursday and Friday.
Voting:
Good: 13
Bad: 2
Tags: highs climate
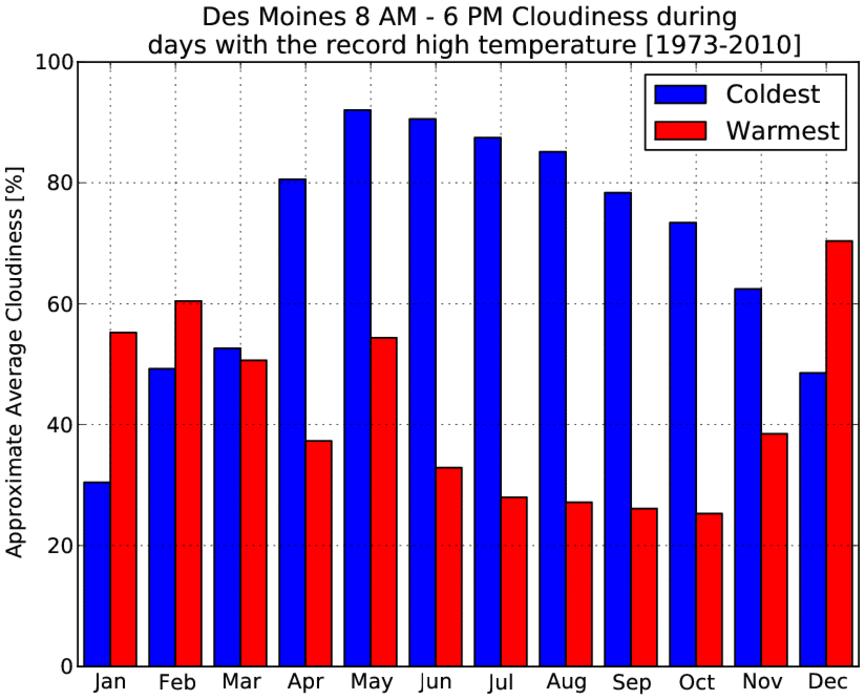
June Highs and Clouds
23 Jun 2011 05:55 AMHigh temperatures on Wednesday struggled in the 60s and were only a few degrees warmer than the coldest high temperatures on record for the date. This was thanks to a thick cloud cover and cold air brought in from our north. The featured chart looks at a measure of the amount of cloud cover on days were the high temperature was at record minimums and maximums. It makes intuitive sense that the coldest days are typically more cloudy during the spring, summer, and fall months as the sun is effective at warming the ground thanks to its high declination. Clouds are less important in the winter months as temperatures are dominated by organized air masses and the sun is less effective. For the warmest temperatures, having more sunny conditions are the most important in October it appears. Outside of a blip for warmest days in May, the plot has two clear annual signals!
Voting:
Good: 14
Bad: 5
Tags: highs climate clouds

Day to Day Changes
05 Apr 2011 06:22 AMThe high temperature on Monday was 30 degrees colder than the high on Sunday of 82. The featured image presents the extreme day to day high temperature changes based on data for Ames. A 30 degree negative change is near the maximum experienced for early April. The chart nicely shows the annual cycle with a minimum in temperature swings during the summer.
Voting:
Good: 8
Bad: 4
Tags: highs

Highs after snowfall
10 Mar 2011 12:18 PMHigh temperatures are struggling so far today thanks to our recent snowfall and being on the cold side of a departing area of surface high pressure. The featured chart presents the high temperature for a day after snowfall as recorded from the long term stations near Ames. The favored temperature is clearly around or just below freezing, which makes sense with all the newly deposited snow around. The greater the snowfall, the more likely the next day temperature will be below freezing, which makes sense as well. Much warmer air is set to arrive tomorrow and rid us of most of this new snow.
Voting:
Good: 16
Bad: 6
Tags: snow highs

About time for warmer air
14 Feb 2011 05:47 AMWow, after being stuck in winter for a period seeming like forever, the warmer air this past weekend sure felt nice and makes spring feel like it is not that far away. The featured chart presents the climatology of when the first occurrence of a temperature happens in the new year. The blue line can be thought of the earliest a given temperature has been observed and the red line would be the latest we have waited for a given temperature in a given year. The green line is the average date of the first observation. So for mid February, we'd expect to have seen at least one day in the lower 50s after 1 January. The turquoise line shows the pain that occurred last year when we had to wait until March to see a temperature above 40.
Voting:
Good: 30
Bad: 4
Tags: spring highs
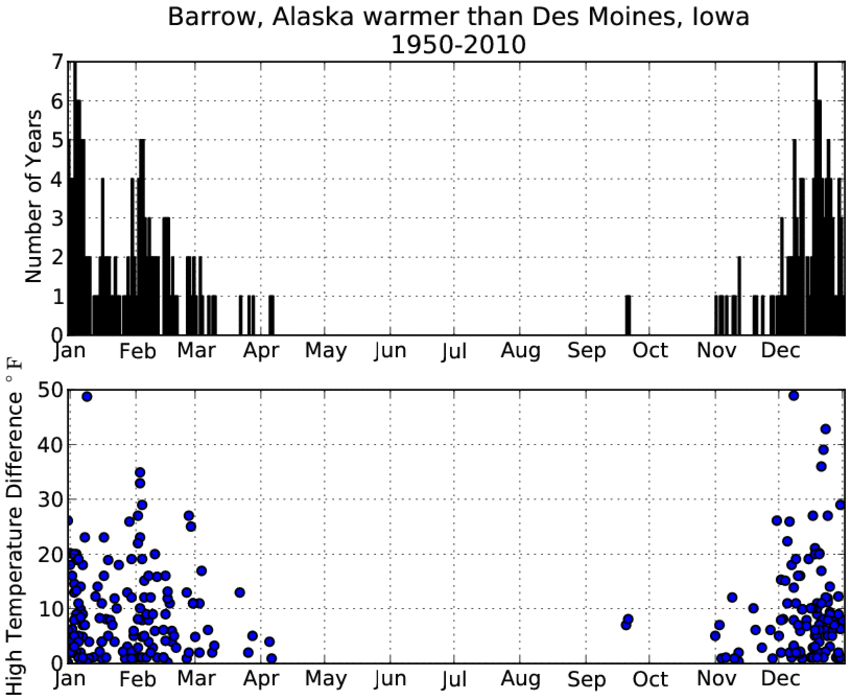
Warmer in Barrow, Alaska
10 Jan 2011 05:47 AMThe high temperature on Sunday in Barrow, Alaska was a balmy 35 degrees whereas Des Moines, Iowa struggled in the 20s. The featured chart presents the daily frequency of occurrence for having Barrow with a warmer high temperature than Des Moines. Given that the chart presents 60 years of data, the chances are still rather slim for having such an occurrence. There have been 251 occurrences overall, so this happens about 4 times per year. The bottom chart presents the actual difference in high temperature on days that Barrow was warmer. The two lone events in September occurred back in 1995 (21 and 22). Temperatures on Monday will come close to accomplishing this rather rare feat with highs in both locations in the low 20s.
Voting:
Good: 26
Bad: 4
Tags: alaska highs

7 days below 60!
14 May 2010 06:07 AMThe abnormally cool stretch of weather ended up lasting a full week for Ames with high temperatures not reaching 60 degrees. According to IEM data, this sets a record for consecutive days below 60 in May. The featured chart displays the monthly records for Ames and the most recent year the record was set or tied. During the winter months, a large number of years had the entire month below 60. It is interesting to see that July never has had a high temperature below 60 for Ames since 1893. Temperatures will approach 70 today!
Voting:
Good: 48
Bad: 8
Tags: may10 highs may

Warmer High Temperature
18 Nov 2009 05:10 AMThanks to a slow moving storm system to our south, places like Lamoni (in Southern Iowa) experienced a cloudy and rainy day while locations farther north like Mason City saw the sun and warmer temperatures. The high temperature in Mason City was 9 degrees warmer than Lamoni. The featured chart looks at the frequency of Mason City having a warmer high temperature than Lamoni (north/south comparison) and also Dubuque having a warmer high than Sioux City (east/west comparison). In November, Mason City is warmer than Lamoni about 10% of the time (think of it as 3 days for the month). The chart shows an interesting annual signal and a probable change in the dominate spatial temperature structure between the summer and wintertime.
Voting:
Good: 18
Bad: 9
Tags: highs

Lack of persistent warmth
20 Oct 2009 06:10 AMHigh temperatures soared on Monday to values above normal for this time of year. The featured chart looks at the largest stretch of consecutive days with the high temperature above average per year for Ames. So far for 2009, the best we did was 11 days. Our current streak stands at a mere one day with today expected to make it two. Rain and cooler temperatures are in the forecast, so the current streak will not last.
Voting:
Good: 17
Bad: 7
Tags: highs

20 degree swings
29 Sep 2009 06:05 AMAfter a high temperature of 82 on Sunday, Ames only got up to 64 on Monday which is almost a 20 degree cool off in high temperature. The featured chart looks at the monthly frequency of having a 20+ degree high temperature swing either up or down. In general, these events are somewhat rare with primary direction being a 20+ degree downward swing.
Voting:
Good: 19
Bad: 6
Tags: highs

Persistent Temperatures
12 Sep 2009 07:38 AMThe past week or so has seen high temperatures not vary much for Ames with the range being a mere 3 degrees (78-81). The featured chart looks at the minimum 7 day temperature range for all days of the year. In general, the lowest values are in the summer time when strong temperature fronts are not common. The spikes during the spring and fall months are when we often experience air mass changes via strong fronts.
Voting:
Good: 8
Bad: 12
Tags: persistence highs lows

Will we see the 90s?
12 Jun 2009 06:10 AMThe featured graph is a simple plot of the number of days per year that Ames has observed a high temperature at or above 90 degrees. 2008 only saw a handful of days while two years in the 1930s experienced 60 days (dust bowl). While the forecast for this weekend is for warmer weather, we will have to wait a while yet before maybe seeing 90 degrees again.
Voting:
Good: 25
Bad: 7
Tags: highs

Warmth and rain
04 Jun 2009 06:04 AMThe featured graph displays the frequency of rainfall observations a day after a given high temperature for Ames. The three lines are the frequency of given minimum precipitation thresholds. While there are a number of things going on to make this plot appear the way it does, it generally shows that the frequency of rainfall events increases as our temperature increases (more rainfall in the summer). The interesting detail is to note what happens when temperatures reach the 90s. Our chances of rainfall decrease as the temperature gets even warmer. One could speculate that when our temperatures get really warm, the air mass is often drier and soil moisture state is drier as well allowing more efficient warm ups. Rewording, having temperatures in the 90s for Ames is probably associated with a dry weather pattern.
Voting:
Good: 15
Bad: 6
Tags: climate precip highs
Highs less than our lows
11 Mar 2009 06:13 AMLast Friday, we were experiencing low temperatures around our average high for the date. Today, we are on the opposite end with high temperatures near our average lows. The featured chart looks at frequency of having the high temperature below the average low. As with Friday's chart, there is a period in the summertime where this has never occured for Ames. Our actual weather is expected to warm up this weekend!
Voting:
Good: 22
Bad: 3
Tags: highs lows

Really warm low temperatures
06 Mar 2009 06:16 AMIn some locations, low temperatures on Thursday were warmer than the average high temperature for the date. The featured chart looks into the frequency of this occurance with the bars representing the number of years that this has occurred for Ames. The red line is the record daily maximum low temperature and the black line is the daily average high temperature. Notice that during the summer season, the black line is always higher. In fact, the period of 9 May to 29 Sep has never seen a low temperature greater than the average high for Ames!
Voting:
Good: 35
Bad: 19
Tags: highs lows

Days above average
02 Mar 2009 06:16 AMThe featured chart is the yearly difference between the number of days with a high temperature above average versus below for Ames. Negative numbers represent having more days below average than above. 1932 has the largest positive value while 1993 the lowest. For our recent decade, 2008 was the only year with a considerable number of more days below average. The number thus far for 2009 is a mere -4. Our weather is expected to creep above average later this week.
Voting:
Good: 27
Bad: 4
Tags: highs yearly climate
How warm can it get today?
26 Dec 2008 09:36 AMThe featured image is a scatter plot of next day high temperatures versus snow depth. The plot tries to answer the question how warm can it get the next day after having snow on the ground today. An old forecasting tip is that high temperatures rarely exceed 43 degrees with 4+ inches of snow on the ground. The 4 inch snow depth reference line on the chart indeed shows very few 43+ degree temperatures. With high temperatures forecasted in the 50s today, this will be exceptionally warm given our current snow pack!
Voting:
Good: 44
Bad: 16
Tags: highs snowcover
When do highs occur?
17 Nov 2008 06:18 AMLast Friday, we featured the favored times of rainfall. Today we featured the favored times of day when the high temperature occurs. This plot has a number of interesting features including the increased chance of the high temperature coming at midnight during the winter season. This is often associated with air mass changes with a steady feed of colder air during the day. Another interesting feature is the shift of high temperature shown between Feb/Mar and Oct/Nov. This is due to the change of daylight savings time. The hourly time axis on the plot is in local (standard/daylight) time depending on the time of year.
Voting:
Good: 27
Bad: 7
Tags: climate highs