Past IEM Features tagged: lows

Coldest Eight Days for Lows
08 Jan 2018 05:33 AMTemperatures on Sunday were downright balmy with high temperatures above freezing and lows above zero! For places like Ames, this was the first day with a low above zero since 29 December making for eight straight days. The featured chart looks at the coldest stretch of eight days based on average low over that period. The horizontal bars denote the period of days and the color denotes the value for that period. The bottom panel displays a frequency for the individual day of the year participating in this period. So having this happen during early January isn't that exceptional, but one wonders if a colder period of eight days could still happen later this winter season? The frequencies would indicate that chances are still good for that to happen.
Voting:
Good: 6
Bad: 0
Tags: lows

Close to Average
24 Jun 2015 05:32 AMHigh temperatures on Tuesday were close to average for much of the state, which is typical for this time of year as shown by the featured chart. The chart displays the percentage of years that the high or low temperature is within five degrees of the NCDC climatology for the location, in this case Ames. The summer months are generally above the 50% value, which means that for a majority of the time the high or low temperature is within five degrees of average. This is thanks to warm ground temperatures and elevated humidity levels that help dampen most wild swings in temperature.
Voting:
Good: 17
Bad: 7
Abstain: 10
Tags: highs lows

Waterloo v Oelwein
15 Jan 2015 05:40 AMOn Monday morning, the low temperature for Waterloo was -16 while just a few miles east at Oelwein it was 8 degrees warmer at -8. The featured chart looks at differences in morning low temperature between the two sites over the course of a year (top plot) and against the average wind speed at Waterloo. The difference in temperature is due to micro climate effects are that are much more common during low wind conditions. Near surface winds help to mix the lower atmosphere and keep temperatures more evenly distributed. When winds relax, local effects happen and rapid cooling may occur at night time. The lower plot clearly shows the difference are most noticeable at low wind speeds. As wind speed increases, the average difference in low temperature approaches zero. This creates a forecasting issue when local weather stations can have large differences in low temperature as compared with their nearby neighbors.
Voting:
Good: 16
Bad: 8
Abstain: 7
Tags: lows

Low Temp Changes
05 Sep 2014 05:43 AMThe low temperature for Des Moines on Thursday was a balmy 76 degrees and much warmer than Wednesday. The low temperature for Friday will be much cooler than yesterday. The featured chart presents the frequencies of day to day changes in low temperature. While the average high and low temperature are decreasing each day as we head into fall, the day to day changes are not always negative this time of year. This illustrates an important distinction between weather and climate. While climate is "pulling" us cooler each day, the weather is actually guiding the day to day differences. The chart does show an annual signal, but the magnitude is only a few percentage points.
Voting:
Good: 17
Bad: 25
Abstain: 15
Tags: lows

Smashing Record Lows
03 Mar 2014 08:42 AMThe Waterloo Airport reported a low temperature of -19 degrees this morning, which beat the previous record by 13 degrees! The featured chart presents the amount a newly set daily record temperature beat the previous record-to-date for that day for Waterloo. A thirteen degree beat for low temperature was the largest departure since 5 Dec 2005. Some of the extreme beats are labelled on this chart and you'll notice most of the dates are in the winter and spring months. Temperatures are more constrained in the summer time thanks to soil temperatures and atmospheric humidity, so it is much more difficult to get large beats of records during those months.
Voting:
Good: 36
Bad: 6
Abstain: 4
Tags: highs lows records

Back above freezing after low
27 Dec 2013 05:44 AMAfter very cold low temperatures on the 24th, highs the next day were back above freezing! The featured chart presents the frequency of having an above freezing high temperature for at least one of the three days following a day with the given low temperature. A linear relationship exists until temperatures reach negative five or so and then the frequencies flatten out. This would indicate that it does not matter how cold temperatures get once they are below negative five. The physical reasoning for this may be that cooling below this level is a local radiation effect and not indicative of a more intense cold air mass which would decrease the chances of returning to above freezing temperatures in the near term future.
Voting:
Good: 69
Bad: 12
Abstain: 4
Tags: lows winter

Last sub zero temps
24 Dec 2013 05:45 AMA very cold air mass, fresh snow pack, and clear skies are helping temperatures to plummet this Tuesday morning. Lows this morning are below zero Fahrenheit for the entire state with some locations pushing values below negative 20! The featured chart presents the period for Des Moines since the last temperature as cold as the given threshold. This morning's lows would be the coldest since the first week of January back in 2010. The good news is that warmer air is expected for the rest of this week with highs even approaching 30 degrees!
Voting:
Good: 44
Bad: 9
Abstain: 6
Tags: winter lows

First sub-zero
13 Nov 2013 05:36 AMThe airport weather sensor for Spencer reported a sub zero Fahrenheit on Tuesday morning making for the first sub zero temperature of the season. The featured map displays the number of years whereby the long-term climate site had the first sub zero temperature of the fall/early winter season. If two or more sites tied for that year, they all got credit for having the earliest value that year. Northwestern Iowa, by far, is the favored location with some subtle topography effects over the Nishnabotna River valley in west- central Iowa. Warmer weather will be building back into the state for the rest of the week with a pleasant weekend in store and highs in the 50s.
Voting:
Good: 24
Bad: 6
Abstain: 3
Tags: subzero lows

Steps down
11 Nov 2013 05:35 AMSince dropping to 27 degrees in late October, the Des Moines Airport has not stepped down below that level since. The featured chart presents the number of days each end of calendar year season that the low temperature set a new low for the season. The tally is started once the temperature dips below 50 degrees after 1 July. The blue bars represent the number of events prior to breaching 32 degrees and the red bars are the total for all events below 50. The chart shows that it takes around 5 events for the temperature to first reach 32 after dropping below 50 and the season total is around 10-15 events. The total so far (not shown) for this year is just seven events, so a number of colder nights appear probable prior to the first of the year. The first of these arriving Monday night with the coldest air of the season and highs on Tuesday struggling near freezing!
Voting:
Good: 19
Bad: 7
Abstain: 8
Tags: lows

Common Temperature Rise
28 Oct 2013 05:36 AMAfter a very chilly start, temperatures warmed nicely in Iowa on Sunday with some places, like Ames, having a 40 degree warmer high than low temperature. The featured chart displays box and whisker plots for the daily temperature rise partitioned by month of the year. Having a 40 degree rise in October is not uncommon, but would be very rare in the mid summer. The box shows the 25th to 75th percentile of the data (half the observations) and the whiskers show the 5th and 95th percentile. It will be a bit before another very nice day like Sunday as wet weather is expected for much of the coming week.
Voting:
Good: 37
Bad: 8
Abstain: 6
Tags: highs lows
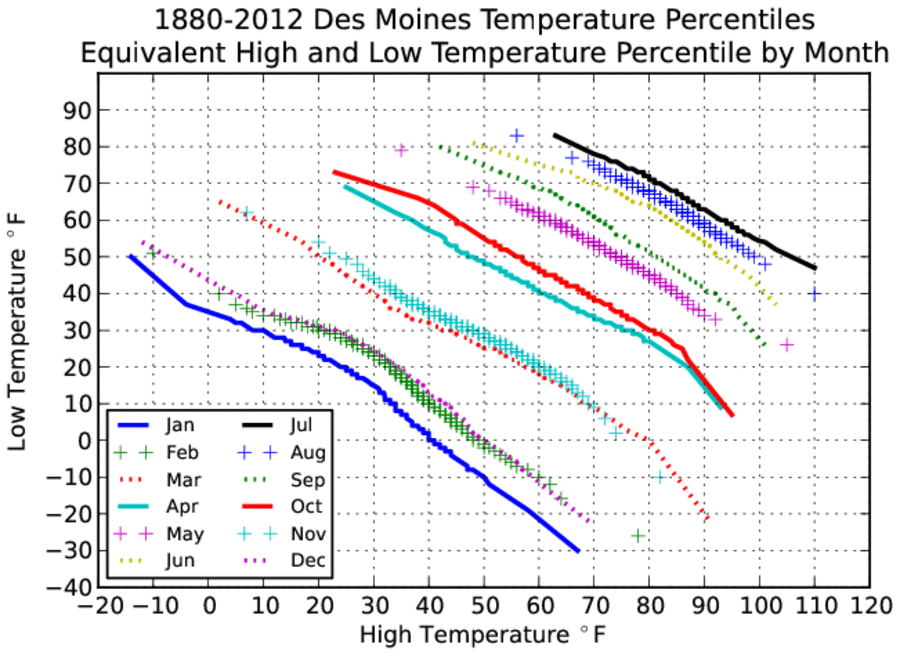
High + Low Percentiles
28 Jul 2013 07:46 AMThe low temperature dipped to 51 degrees for Des Moines on Sunday morning, which set a record low temperature. How common is this cold of a temperature in July? The featured chart presents a means by which low temperature frequencies can be compared to high temperature frequencies by equating their respective percentiles. A line is shown for each month of the year. So for July, the 51 degree low temperature compares with a high temperature around 104. Restating, Des Moines has about the same number of days at or below 51 degrees for a low temperature as it does for having a high temperature at or above 104. So you could say the weather this morning is as common as a high of 104!
Voting:
Good: 118
Bad: 13
Tags: qq climate highs lows

Snow Cover and Cold Lows
27 Nov 2012 05:39 AMTemperatures dropped quickly Monday evening thanks to clear skies and calm conditions. Our saving grace was ground temperatures which are still warm for this time of the year and the lack of snow cover, which prevented temperatures from dropping even further. Snow cover is a game changer when it comes to the surface energy balance during the day and night time. It acts to mostly seperate the exchange of energy from the sun to the soil and back to the air. The featured chart presents the frequency of having snow cover at a given daily low temperature (blue line) and the overall frequency of that temperature (red line). The main point is to show that the coldest temperatures are increasing associated with the presence of snow cover. For example, a low temperature of zero degrees also had snow cover present 90% of the time. The chart also had an interesting (but unexplained here) aspect of having the lines cross at the 50% probabilities for both y-axes around 18 degrees. It is difficult for near surface soil temperatures to get cold enough to support very cold air temperatures, so snow cover is increasing necessary for the coldest temperatures.
Voting:
Good: 40
Bad: 7
Tags: lows snowcover

Winter's Coldest Low
14 Jan 2011 05:55 AMLow temperatures on Thursday were some of the coldest this winter season. The featured chart presents a comparison of the coldest temperature observed for a winter season against the day on which it occurred. The scattering of points on the chart would indicate no clear relationship as just about any time during the winter could experience the coldest low of the year. More very cold weather is expected next week.
Voting:
Good: 30
Bad: 12
Tags: lows

Below zero is a given
13 Jan 2011 05:59 AMLow temperatures for today were below zero for many parts of Iowa. The featured chart shows that having a below zero temperature during the winter season has happened each year on record for Ames. Temperatures are expected to recover nicely today, but only into the teens.
Voting:
Good: 21
Bad: 2
Tags: lows
First cold and snow cover
15 Dec 2009 06:08 AMThe featured chart looks at the presence of snow cover during the first fall/winter occurrence of a given low temperature based on data from the Ames COOP station. While having snow cover is not a requirement for really cold temperatures, it certainly is present more often than not for the first temperature below zero of the season.
Voting:
Good: 15
Bad: 6
Tags: snowcover lows
Below average lows
16 Oct 2009 06:08 AMThe featured chart displays the yearly net total of days above average for low temperature (negative values would mean that more days were below average than above). So far in 2009, Ames has seen 50 more days below average for low temperature. This is roughly the largest negative value we have seen in the last 40 years, granted there are 2.5 months left to this year yet.
Voting:
Good: 34
Bad: 15
Tags: lows

Persistent Temperatures
12 Sep 2009 07:38 AMThe past week or so has seen high temperatures not vary much for Ames with the range being a mere 3 degrees (78-81). The featured chart looks at the minimum 7 day temperature range for all days of the year. In general, the lowest values are in the summer time when strong temperature fronts are not common. The spikes during the spring and fall months are when we often experience air mass changes via strong fronts.
Voting:
Good: 8
Bad: 12
Tags: persistence highs lows
Highs less than our lows
11 Mar 2009 06:13 AMLast Friday, we were experiencing low temperatures around our average high for the date. Today, we are on the opposite end with high temperatures near our average lows. The featured chart looks at frequency of having the high temperature below the average low. As with Friday's chart, there is a period in the summertime where this has never occured for Ames. Our actual weather is expected to warm up this weekend!
Voting:
Good: 22
Bad: 3
Tags: highs lows

Really warm low temperatures
06 Mar 2009 06:16 AMIn some locations, low temperatures on Thursday were warmer than the average high temperature for the date. The featured chart looks into the frequency of this occurance with the bars representing the number of years that this has occurred for Ames. The red line is the record daily maximum low temperature and the black line is the daily average high temperature. Notice that during the summer season, the black line is always higher. In fact, the period of 9 May to 29 Sep has never seen a low temperature greater than the average high for Ames!
Voting:
Good: 35
Bad: 19
Tags: highs lows

When do lows occur?
18 Nov 2008 06:21 AMKeeping with the recent features, today's feature is a chart of the hour during which the low temperature occurs. Low temperatures tend to occur just after sunrise when net radiation finally becomes positive (downward). This chart shows this trend with lows happening earlier in the morning during the summer. You can also see a secondary maximum around 11 PM, which is often the case when clear skies at night follow a cloudy day allowing temperatures to drop rapidly below levels during the cloudy morning.
Voting:
Good: 23
Bad: 12
Tags: climate lows