Accumulated days
Posted:
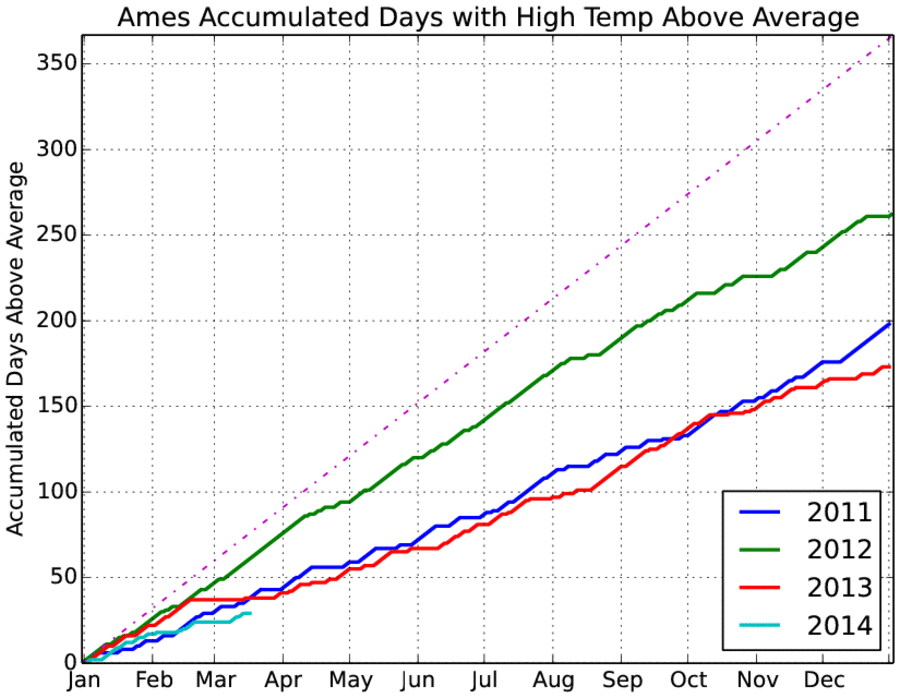
The featured map yesterday compared total number of days with above average high
temperature so far this year over the Midwest. Today's chart shows the total number of
days again with above average high temperature to date for the past four years. The
dashed line would be having every day above average and it amazing to see 2012 so close
to that line! This year's total has been much smaller than the previous three years and the
forecast does not hold much hope to significantly adding to it.
Voting:
Good = 24
Bad = 8
Abstain = 6
Tags: 2012
Voting:
Good = 24
Bad = 8
Abstain = 6
Tags: 2012