Past Features
This page lists out the IEM Daily Features for a month at a time. Features have been posted on most days since February 2002. List all feature titles.
Thu May 01, 2025
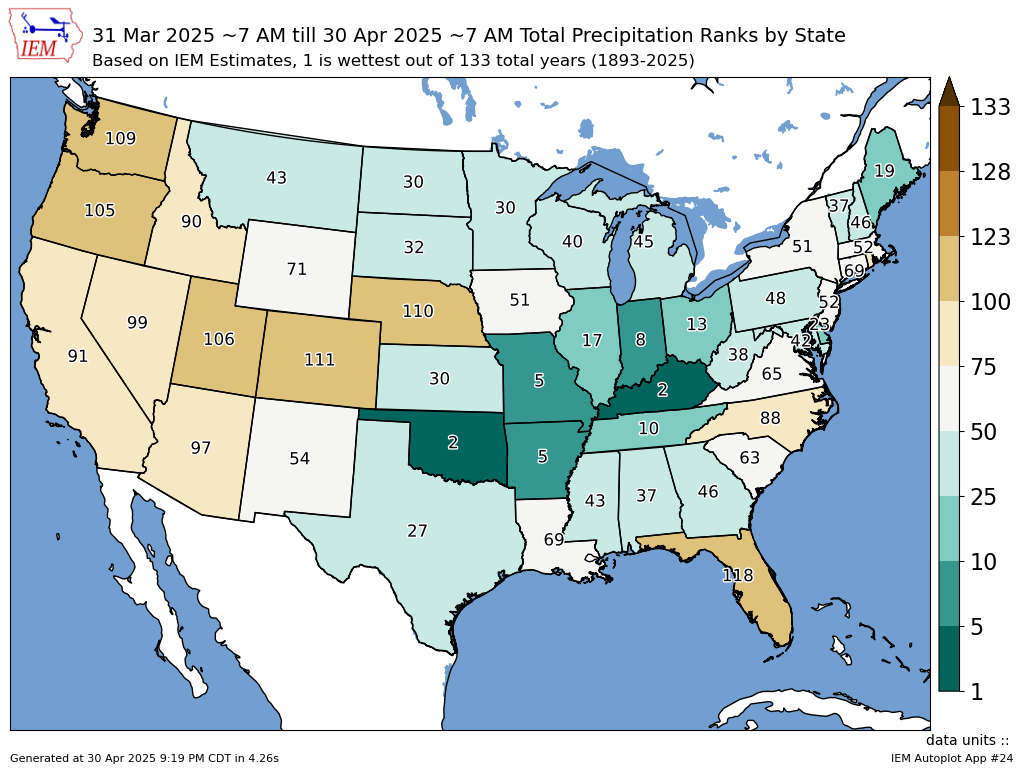
April Statewide Ranks
01 May 2025 05:30 AM
The IEM produces unofficial daily statewide (spatially averaged) estimates of precipitation. NCEI produces a more official statewide estimate as well, but only publish monthly data delayed by a week or so. The featured map presents what the IEM computes for statewide April 2025 precipitation ranks with a value of one indicating the wettest April since 1893 for the state. The map shows remarkable variability with Iowa and certainly Nebraska missing out on the very wet month that just completed. There's an additional accounting quirk that should be mentioned and that being these "daily" values represent 24 hour totals ending at about 7 AM, so to match most current NWS COOP reporting. You can find these statewide values available for download along with the other long term climate sites tracked by the IEM.
Voting: Good - 11 Bad - 0
Generate This Chart on Website
Fri May 02, 2025
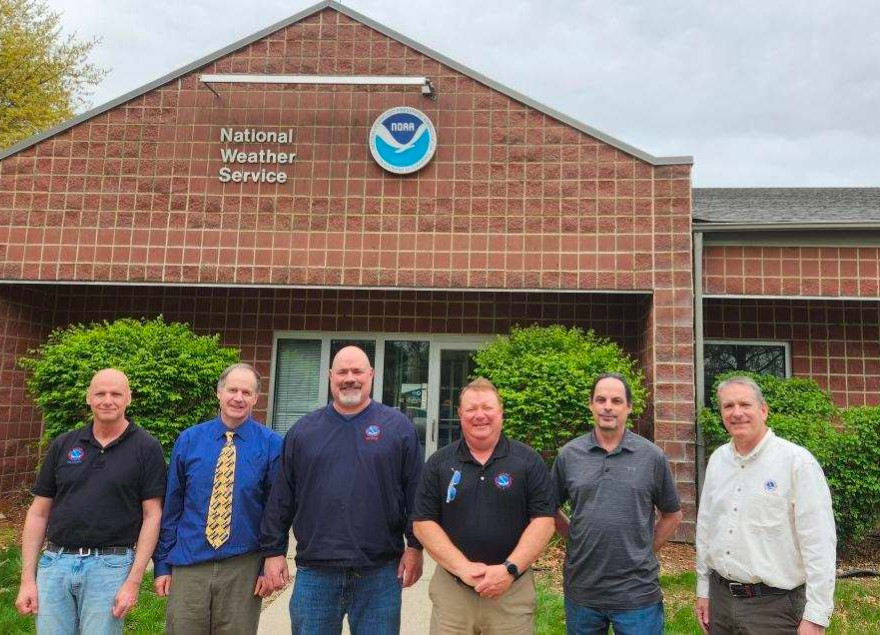
View larger image
Left to right, Marvin Percha, Roger Vachalek, Craig Cogil, Shane Searcy, Darren Gregory, and Brad Small
Goodbye NWS Friends
02 May 2025 05:30 AM
This week was a bitter pill to swallow as a large number of National Weather Service employees took (early) retirement as a part of continued downsizing of the federal government. Scores of these employees the IEM (read myself) has interacted with over these past 25 years as we collaborated on datasets and tools to further our collective goals of supporting science, industry, and the public. The featured picture is of just those retiring from the Des Moines office. Roger, second from the left, was one of my idols growing up in Eastern Iowa and a big reason I got into Meteorology. Craig was an extremely avid IEM advocate, passionate about creating quality climate products, and provided invaluable feedback on IEM website tools in this space. Shane and Brad were on the team, with myself, that created the instant messaging system the NWS used to collaborate with partners (named IEMChat then NWSChat). An incredible amount of knowledge and expertise forecasting Iowa's weather is now gone. With about 25% of the total NWS workforce now gone nationwide and perhaps more cuts coming, the organization, services, and datasets of the NWS are under going major changes. Goodbye NWS Friends.
- daryl
Voting: Good - 53 Bad - 0
Tags: nws
Mon May 05, 2025
Unfrozen Two Weeks
05 May 2025 05:30 AM
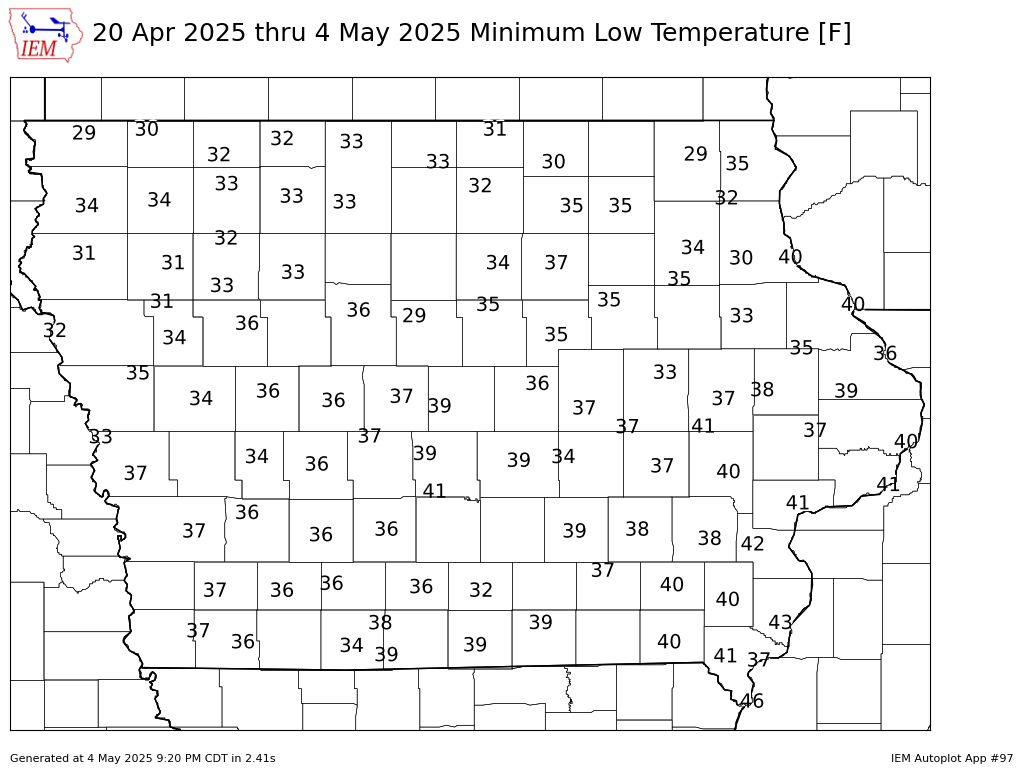
The last few weeks of April and first week or so of May are always tenuous for Iowa as newly planted crops and early developing plants can be susceptible to frost risks. This year the state has fared quite well over this period and the near term forecast looks to continue our recent trend. The featured map presents minimum low temperatures over the past two week based on long term climate sites tracked by the IEM. Sub freezing temperatures have been very isolated with most of the state substantially above freezing for this period. Of course, there are micro-climate scale areas of the state not well represented by these point observations, but those areas will see such frost risks each year and are locally well known. While not attempting to jinx the situation, the one to two week out forecast models continue to advertise a very warm middle of May.
Voting: Good - 13 Bad - 0
Generate This Chart on Website
05 May 2025 05:30 AM
The last few weeks of April and first week or so of May are always tenuous for Iowa as newly planted crops and early developing plants can be susceptible to frost risks. This year the state has fared quite well over this period and the near term forecast looks to continue our recent trend. The featured map presents minimum low temperatures over the past two week based on long term climate sites tracked by the IEM. Sub freezing temperatures have been very isolated with most of the state substantially above freezing for this period. Of course, there are micro-climate scale areas of the state not well represented by these point observations, but those areas will see such frost risks each year and are locally well known. While not attempting to jinx the situation, the one to two week out forecast models continue to advertise a very warm middle of May.
Voting: Good - 13 Bad - 0
Generate This Chart on Website
Tue May 06, 2025
Rare May Wind + Temp Combo
06 May 2025 05:30 AM
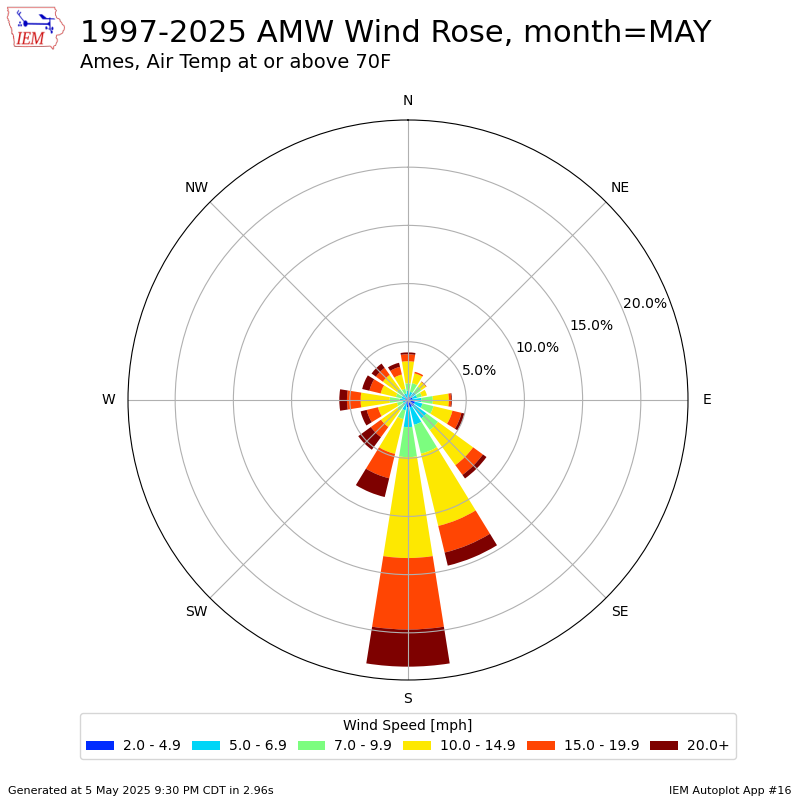
Monday was a spectacular early May day of weather for Iowa with afternoon temperatures near 70 and an east to northeast breeze. Such a combination of temperature and wind direction is a bit rare for May as shown by the featured wind rose. The wind rose presents wind speed and direction frequencies during May for Ames when the air temperature is at least 70°F. The smallest frequencies shown are from the ENE and NE. Our present weather is being dominated by a near stationary upper level trough that is "cut off" to our south and east. This has our flow from the east as it spins counter-clockwise. This system will eventually lift northeast and we'll have a chance of showers on Wednesday.
Voting: Good - 12 Bad - 0
Tags: may
Generate This Chart on Website
06 May 2025 05:30 AM
Monday was a spectacular early May day of weather for Iowa with afternoon temperatures near 70 and an east to northeast breeze. Such a combination of temperature and wind direction is a bit rare for May as shown by the featured wind rose. The wind rose presents wind speed and direction frequencies during May for Ames when the air temperature is at least 70°F. The smallest frequencies shown are from the ENE and NE. Our present weather is being dominated by a near stationary upper level trough that is "cut off" to our south and east. This has our flow from the east as it spins counter-clockwise. This system will eventually lift northeast and we'll have a chance of showers on Wednesday.
Voting: Good - 12 Bad - 0
Tags: may
Generate This Chart on Website
Wed May 07, 2025

2024 Iowa County Corn Yields
07 May 2025 05:30 AM
The weekly USDA NASS update released yesterday provided a first glimpse in their county yield estimates for 2024. The featured map presents an IEM computation of the 2024 county estimate departure from a simple previous ten year average for corn grain. A number of counties have no estimated data yet for unknown reasons at this time. The spatial trend though is rather clear with a NW to SE gradient of yield departures with most positive (higher than average) values found over SE Iowa. The late in growing season drought really put a dent in yields over NW Iowa compared with the rest of the state. The drought situation going into this year isn't all that bad, but rain has again been fickle this month so far and deficits can quickly accumulate this time of year as water demands increase.
Voting: Good - 14 Bad - 2
Tags: corn
Generate This Chart on Website
Thu May 08, 2025

Totaling Up 80 Degree Days
08 May 2025 05:30 AM
It certainly felt a bit like summer in Iowa on Wednesday with even some isolated thunderstorms popping up mid afternoon. Temperatures reached 80°F for about half of the state. Of course, we are just getting started with having such warm days as is the subject of today's Daily Feature. The chart presents the first day of the year with a high temperature of at least 80°F for Ames and the subsequent number of such days for that year. This year got off to an early start for such days with the first day coming in March. The data shows an average of about 90 days per year, so roughly 25% of the year!
Voting: Good - 14 Bad - 0
Tags: 80
Generate This Chart on Website
Fri May 09, 2025
Accumulating 120 GDDs
09 May 2025 05:30 AM
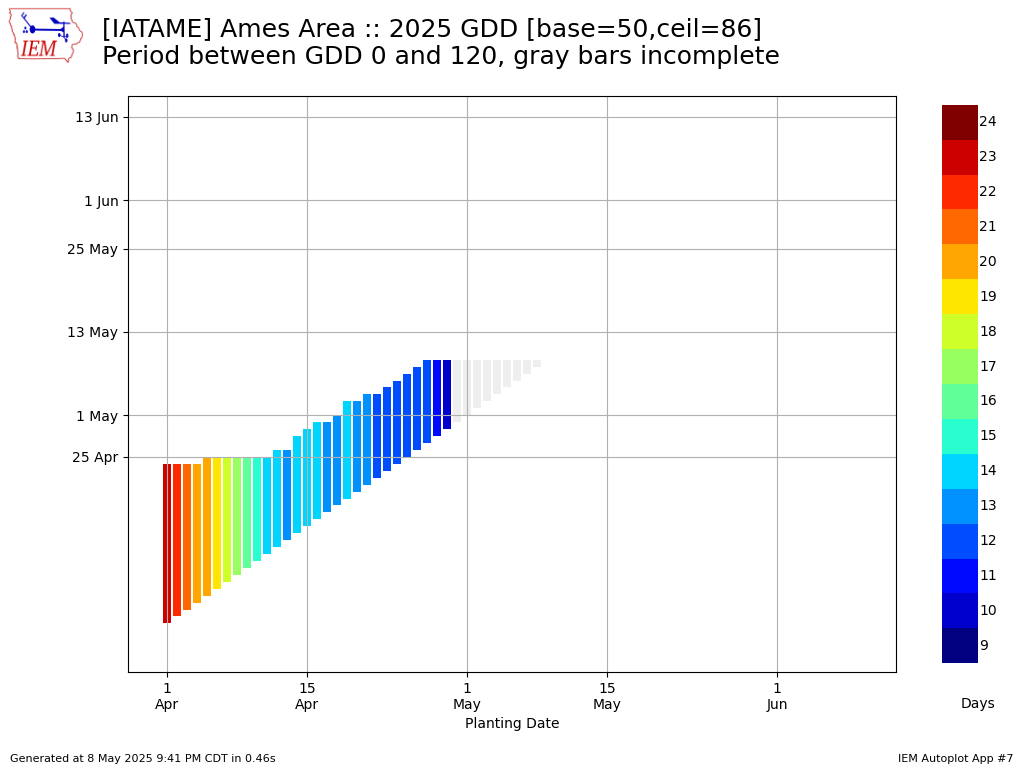
Corn planting by Iowa farmers is off to an excellent start and looks to make continued progress over the coming week with dry and warm/hot weather forecast. For soils with sufficient moisture, this warm weather upcoming will support rapid seed germination and plant emergence. The featured chart looks into this by plotting the period to accumulate at least 120 Growing Degree Days (GDD)s by a given start date (planting date) for Ames. The 120 value is not a rigid growth requirement and is based on air temperature, instead of soil temperature, which more governs development over this period. The value is ballpark though and illustrative of things that happen during the early growing season. Consider a planting date of 1 April. It took over three weeks to reach this GDD accumulation threshold. For mid April planting dates, the period is down to two weeks and now is presently running just over one week. This is the general caveat for planting too early in the season, the seeds will sit in the ground for a while awaiting warmer temperatures. This can be a vulnerable period for pathogens and other sub-optimal things, particularly if the soils are very wet as well.
Voting: Good - 19 Bad - 1
Tags: gdd
Generate This Chart on Website
09 May 2025 05:30 AM
Corn planting by Iowa farmers is off to an excellent start and looks to make continued progress over the coming week with dry and warm/hot weather forecast. For soils with sufficient moisture, this warm weather upcoming will support rapid seed germination and plant emergence. The featured chart looks into this by plotting the period to accumulate at least 120 Growing Degree Days (GDD)s by a given start date (planting date) for Ames. The 120 value is not a rigid growth requirement and is based on air temperature, instead of soil temperature, which more governs development over this period. The value is ballpark though and illustrative of things that happen during the early growing season. Consider a planting date of 1 April. It took over three weeks to reach this GDD accumulation threshold. For mid April planting dates, the period is down to two weeks and now is presently running just over one week. This is the general caveat for planting too early in the season, the seeds will sit in the ground for a while awaiting warmer temperatures. This can be a vulnerable period for pathogens and other sub-optimal things, particularly if the soils are very wet as well.
Voting: Good - 19 Bad - 1
Tags: gdd
Generate This Chart on Website
Mon May 12, 2025

Near Warmest Mothers Day
12 May 2025 05:30 AM
Temperatures were quite warm this weekend and particularly on Mothers Day, which was an encore to the warmth seen last year on the same Sunday. Much of northwestern Iowa topped out above 90°F, with Sioux City hitting 90°F for the first time this year. The featured chart presents the Mothers Day high temperature reports for Sioux City. The simple overall average is close to 70°F. The warmth looks to stick around for this week, which is good to remove any chances of a late freeze for a climatologically dangerous week for cold, but it also will include minimal chances of rainfall, which we very much need.
Voting: Good - 14 Bad - 2
Tags: mothersday
Generate This Chart on Website
Tue May 13, 2025

Good GDD Start
13 May 2025 05:30 AM
The growing season is off to a rather good start this year with near no late season cold and enough moisture to help planted crops germinate. The featured chart presents accumulated growing degree days for Ames since mid April. This year's accumulation is plotted along with last year's as well as the climatological range and simple average. The bottom panel shows the accumulated departure from average. The recent May warmth can be seen with accumulated positive departures increasing. The only downside has been the below average rainfall, but dry conditions are helpful for making planting progress. The good news is that better chances of rain will be coming next week and temperatures look to remain well above freezing for the state for the foreseeable future.
Voting: Good - 9 Bad - 0
Generate This Chart on Website
Wed May 14, 2025
Nearing Two Weeks
14 May 2025 05:30 AM
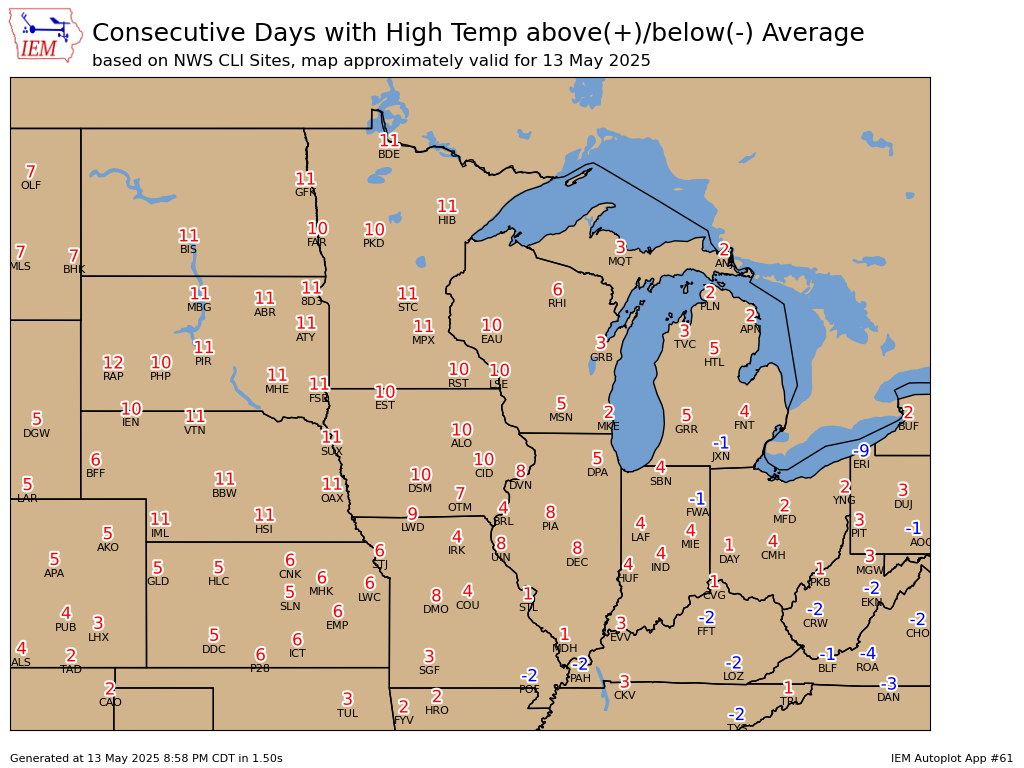
Tuesday was yet another very warm day for mid May with temperatures well into the 80s for most of the state. Based on the NWS CLI-Reporting sites, the featured map presents some of the present streaks with a daily high temperature above (red) or below (negative blue numbers) average. Much of Iowa is nearing two weeks straight with an above average high temperature. The present forecast keeps above average highs going until early next week.
Voting: Good - 13 Bad - 0
Generate This Chart on Website
14 May 2025 05:30 AM
Tuesday was yet another very warm day for mid May with temperatures well into the 80s for most of the state. Based on the NWS CLI-Reporting sites, the featured map presents some of the present streaks with a daily high temperature above (red) or below (negative blue numbers) average. Much of Iowa is nearing two weeks straight with an above average high temperature. The present forecast keeps above average highs going until early next week.
Voting: Good - 13 Bad - 0
Generate This Chart on Website
Thu May 15, 2025

May Temp Percentiles
15 May 2025 05:30 AM
Our current stretch of warm May temperatures continued on Wednesday with highs again well into the 80s for most of the state. The featured plot checks in on hourly temperature percentiles for the month of May using period of record observations from Ames. Of interest is the bottom left panel, which shows the hourly temperature percentiles so far this month. These are computed against the hourly temperatures for May over the period of record. The side histogram for the panel shows that we have seen a balance of cool and warm temperatures for this month with the highest frequencies coming somewhere near the middle. Slightly cooler temperatures will arrive for the weekend, but still will be on the warm side of average.
Voting: Good - 8 Bad - 0
Generate This Chart on Website
Fri May 16, 2025
6,000th Daily Feature
16 May 2025 05:30 AM
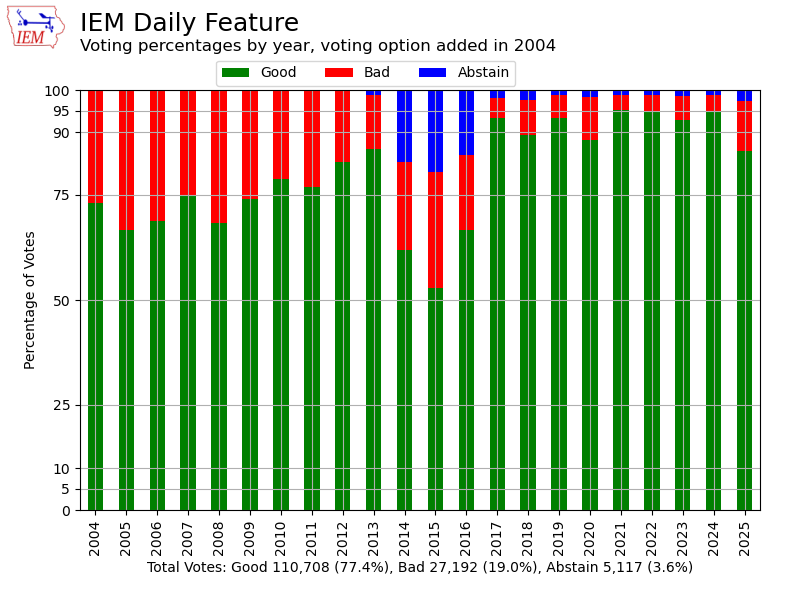
Today's IEM Daily Feature marks the arbitrarily large and round number of 6,000th published in the series. The first feature was published back on 4 Feb 2002 as a lame one sentence statement on how cold it was. The intention was to highlight something of current and relevant interest to users of the website and help motivate the development of such plots and tooling to help generate daily feature content. During 2004, informal and easily manipulated voting was added as an option to provide the IEM feedback on if the posted feature content was of interest to the website user. The meta featured chart today shows the yearly voting percentages. The outlier years of 2014 through 2016 were due to unfortunate bugs with the technical implementation of voting and some routine manipulation, but anyway. The belief is that these features are still found useful by the community and a cathartic expression by the website's developer, so here's to the next 6,000 posted featured to come!
Voting: Good - 39 Bad - 4
Tags: iem feature
16 May 2025 05:30 AM
Today's IEM Daily Feature marks the arbitrarily large and round number of 6,000th published in the series. The first feature was published back on 4 Feb 2002 as a lame one sentence statement on how cold it was. The intention was to highlight something of current and relevant interest to users of the website and help motivate the development of such plots and tooling to help generate daily feature content. During 2004, informal and easily manipulated voting was added as an option to provide the IEM feedback on if the posted feature content was of interest to the website user. The meta featured chart today shows the yearly voting percentages. The outlier years of 2014 through 2016 were due to unfortunate bugs with the technical implementation of voting and some routine manipulation, but anyway. The belief is that these features are still found useful by the community and a cathartic expression by the website's developer, so here's to the next 6,000 posted featured to come!
Voting: Good - 39 Bad - 4
Tags: iem feature
Mon May 19, 2025
Dry Stretch of May
19 May 2025 05:30 AM
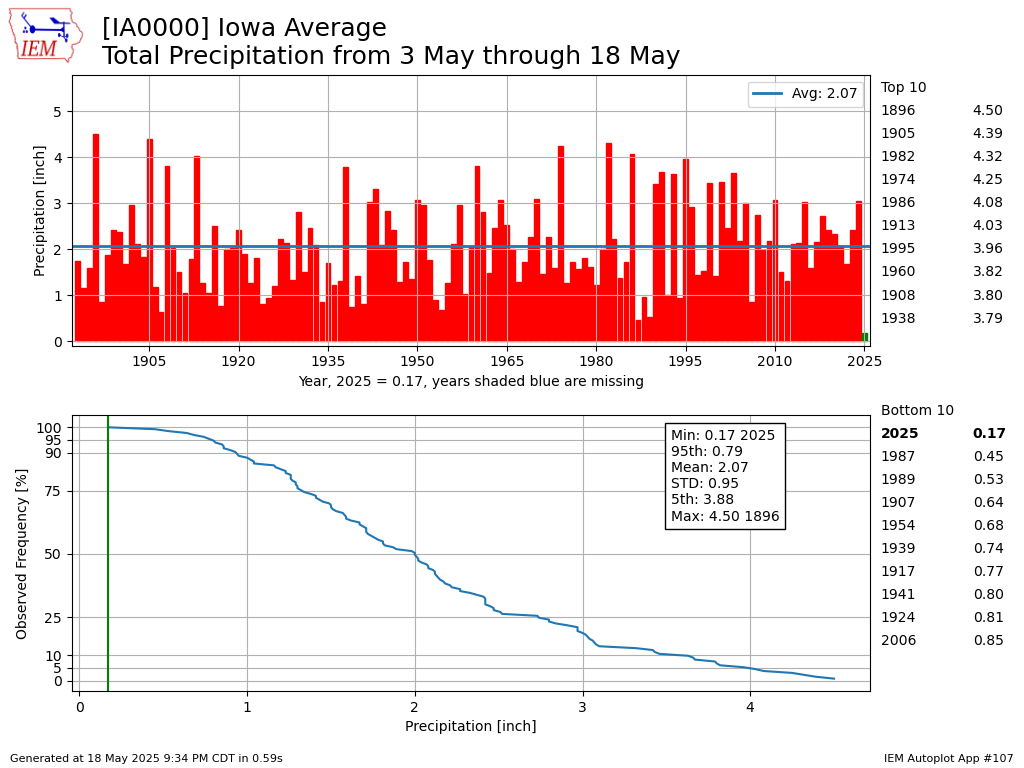
Sunday was the last of a very dry stretch of May days with very little precipitation over Iowa. Based on unofficial IEM estimates, the statewide rainfall total between 3 and 18 May was just 0.17 inches. For these cherry picked days, this is easily the lowest total on record as shown by the featured chart. The simple average for this period is just north of two inches. This dry period has certainly allowed farmers to make significant planting progress and the rainfall coming this week is very much welcome to help get these newly planted crops developing.
Voting: Good - 14 Bad - 0
Generate This Chart on Website
19 May 2025 05:30 AM
Sunday was the last of a very dry stretch of May days with very little precipitation over Iowa. Based on unofficial IEM estimates, the statewide rainfall total between 3 and 18 May was just 0.17 inches. For these cherry picked days, this is easily the lowest total on record as shown by the featured chart. The simple average for this period is just north of two inches. This dry period has certainly allowed farmers to make significant planting progress and the rainfall coming this week is very much welcome to help get these newly planted crops developing.
Voting: Good - 14 Bad - 0
Generate This Chart on Website
Tue May 20, 2025

Much Needed Rain
20 May 2025 05:38 AM
The featured map presents Iowa Flood Center estimated precipitation from Sunday through about 5 AM this Tuesday morning. Rain continues to fall this morning over the eastern half of the state, so hopefully the totals can increase over northern Iowa that are still indicated below an inch from this important rainfall event. As was shown by yesterday's feature, Iowa had been quite dry over the two weeks and this rainfall was very much needed.
Voting: Good - 20 Bad - 0
Generate This Chart on Website
Wed May 21, 2025

New May Daily Record
21 May 2025 05:30 AM
It appears that the rainfall deficits accumulated over much of Iowa during the dry start to May were made up for over a two day stretch from Monday into Tuesday. Des Moines reported a daily rainfall record of 3.84" on 19 May (Monday), destroying the previous daily record of just 1.14" back in 1937. This total also established a new single day record during the month of May for the site as shown by the featured chart. The chart displays the single day largest precipitation totals by month. The right hand side cartoon just denotes which day of the given month had the record. These extreme precipitation events are in direct relation to the potential amount of water vapor held in the atmosphere. A warmer atmosphere can hold more water, so you find the largest totals when the atmosphere is the warmest (summer time). Additionally, summer events are aided by slower storm movements and more intense lower atmosphere moisture transport by the "Low Level Jet", which allows single storms to dump larger precipitation totals over a smaller area.
Voting: Good - 9 Bad - 2
Generate This Chart on Website
Thu May 22, 2025
Daily Precip Histogram
22 May 2025 05:30 AM
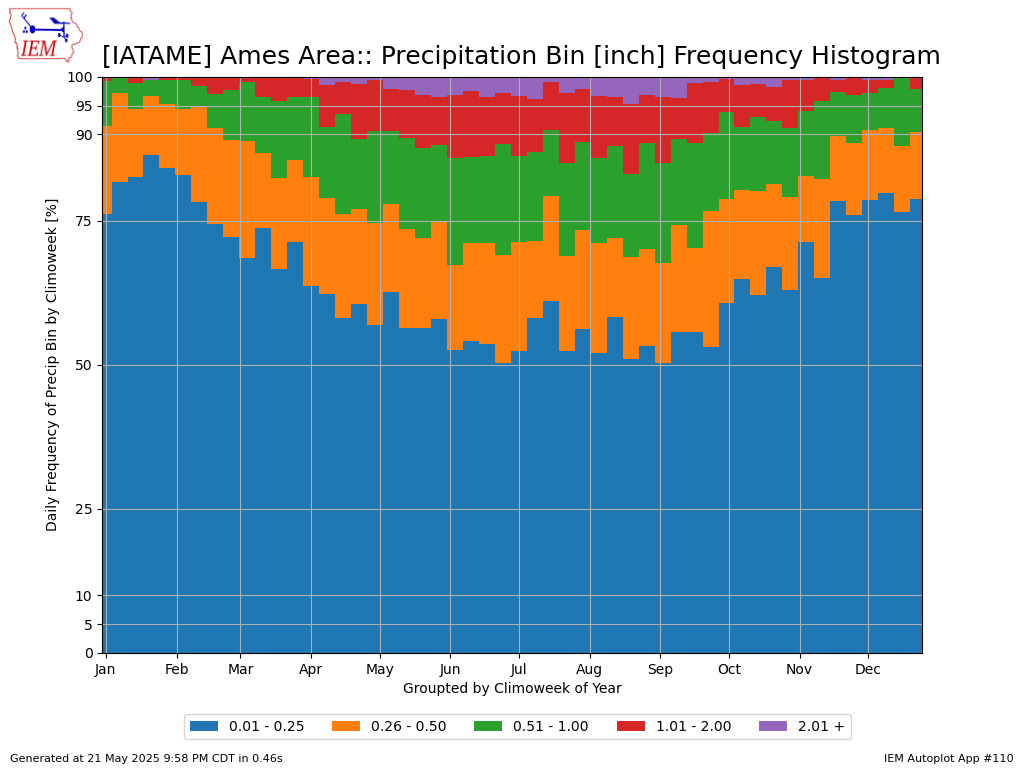
With the heavy precipitation event earlier this week, it is a good time to check in on the frequency of such events. The featured chart presents a stacked histogram of the frequency of daily precipitation totals partitioned by week of the year for Ames. All weeks are normalized, so the frequencies are relative to the number of events for that week. Of interest are the weekly frequencies of greater than two inches of precipitation. The frequencies are rather consistent from mid May through August at about 3%, so roughly one out of every thirty three precipitation events are above two inches.
Voting: Good - 13 Bad - 0
Generate This Chart on Website
22 May 2025 05:30 AM
With the heavy precipitation event earlier this week, it is a good time to check in on the frequency of such events. The featured chart presents a stacked histogram of the frequency of daily precipitation totals partitioned by week of the year for Ames. All weeks are normalized, so the frequencies are relative to the number of events for that week. Of interest are the weekly frequencies of greater than two inches of precipitation. The frequencies are rather consistent from mid May through August at about 3%, so roughly one out of every thirty three precipitation events are above two inches.
Voting: Good - 13 Bad - 0
Generate This Chart on Website
Fri May 23, 2025
Boone County Corn Yields
23 May 2025 05:30 AM
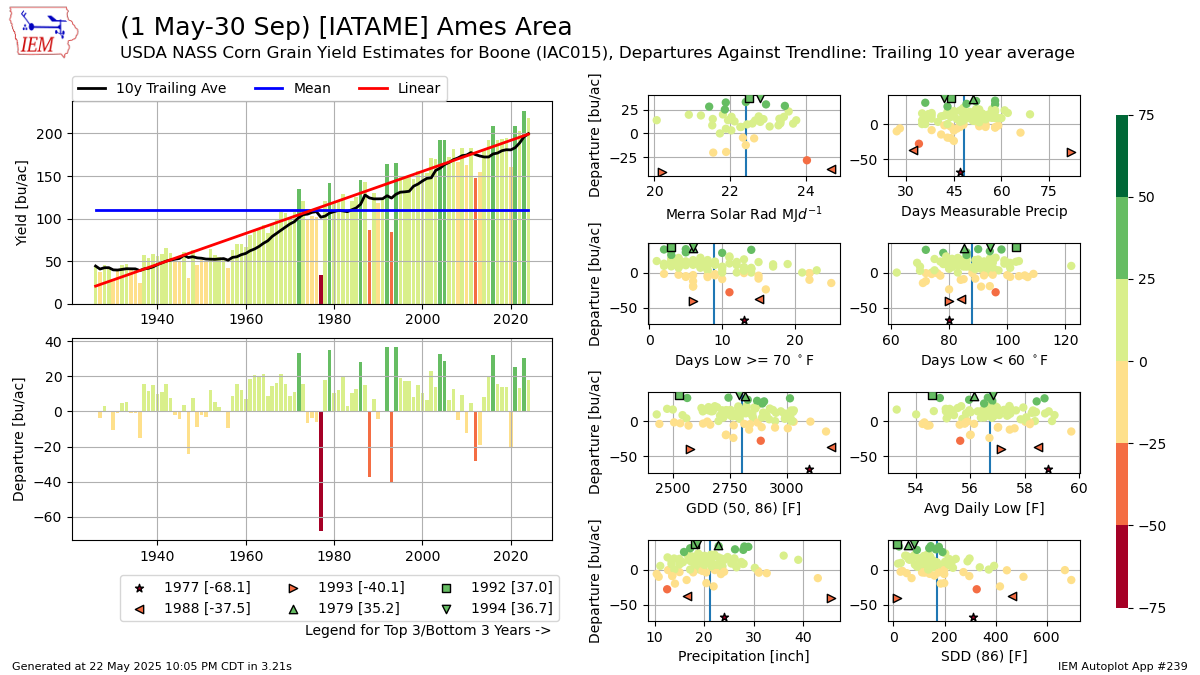
With USDA NASS's recent release of 2024 county corn yield estimates, it is a good time to plot up a bit of a deep dive comparing yearly yields and weather metrics. The featured chart combines the Boone County NASS corn yields with the long term Ames climate site data. As as aside, while Ames is mostly in Story County, the long term climate site was at the research farm west of town in Boone County for a good chunk of the period of record data. The top left panel shows the yearly yield values along with a linear trend line, trailing 10 year average, and simple mean plotted. The lower left panel plots the yearly departure against the 10 year trend line. The three worst and three best years against the trend are assigned special markers for the right side eight panels presenting various weather metrics between 1 May and 30 September. The bottom two right side panels tell a good story with too little and too much precipitation being negative for corn yields along with increasing Stress Degree Days (SDD)s decreasing yields. Of course, there is no magic metric between weather variables and corn yields, but it is certainly fun to play around with the data and see if you can spot any trends. You can follow the "generate this chart" link and generate more charts like this for your periods and location of choice.
Voting: Good - 12 Bad - 0
Tags: corn
Generate This Chart on Website
23 May 2025 05:30 AM
With USDA NASS's recent release of 2024 county corn yield estimates, it is a good time to plot up a bit of a deep dive comparing yearly yields and weather metrics. The featured chart combines the Boone County NASS corn yields with the long term Ames climate site data. As as aside, while Ames is mostly in Story County, the long term climate site was at the research farm west of town in Boone County for a good chunk of the period of record data. The top left panel shows the yearly yield values along with a linear trend line, trailing 10 year average, and simple mean plotted. The lower left panel plots the yearly departure against the 10 year trend line. The three worst and three best years against the trend are assigned special markers for the right side eight panels presenting various weather metrics between 1 May and 30 September. The bottom two right side panels tell a good story with too little and too much precipitation being negative for corn yields along with increasing Stress Degree Days (SDD)s decreasing yields. Of course, there is no magic metric between weather variables and corn yields, but it is certainly fun to play around with the data and see if you can spot any trends. You can follow the "generate this chart" link and generate more charts like this for your periods and location of choice.
Voting: Good - 12 Bad - 0
Tags: corn
Generate This Chart on Website
Tue May 27, 2025

Spring Season Average RH
27 May 2025 05:30 AM
If you define the spring season as the months of March through May, this year's spring only has a few days left. The featured chart checks in on yearly distributions of average daily relative humidity as computed by the IEM based on available observations. Each year's daily observations are presented as a half-violin plot, which attempts to provide a histogram of the distribution. Years with a mean (small blue line) above the simple average are shown in green and the others in tan. This year's distribution comes in on the low end of the plotted data since 2000. Data is only plotted back to 2000 to help with plot legibility. You can find the daily averaged relative humidity values available for download here.
Voting: Good - 8 Bad - 0
Generate This Chart on Website
Wed May 28, 2025
Ames Precip Hours
28 May 2025 05:30 AM
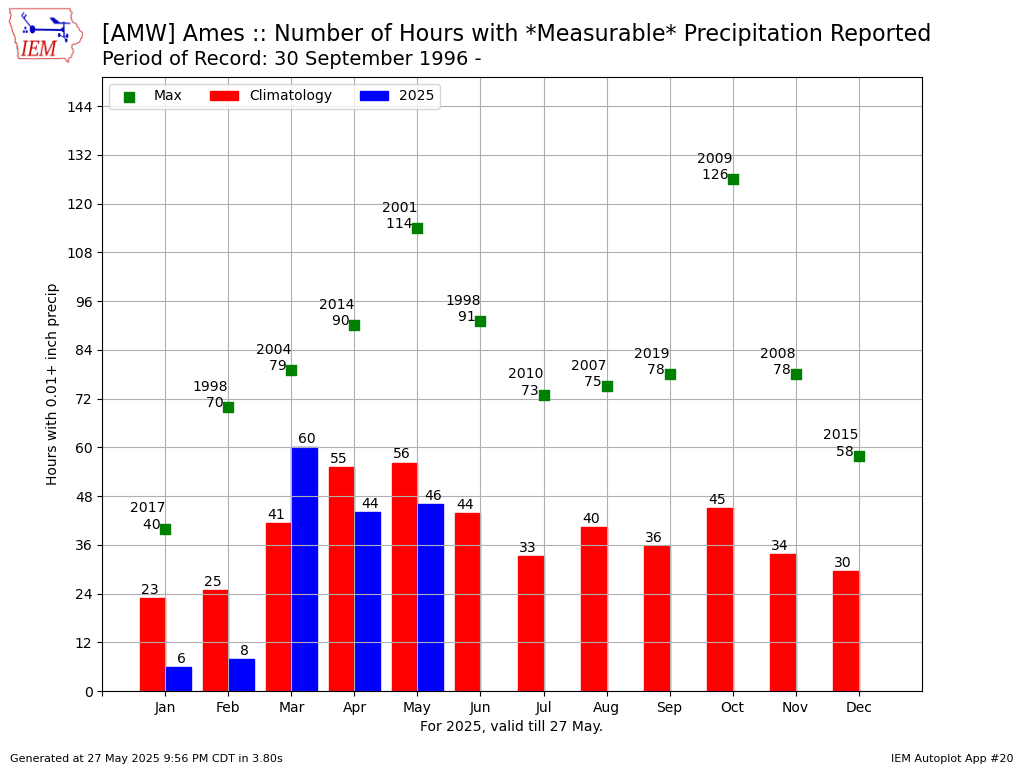
Tuesday was a rather dreary day with plenty of clouds and rain/drizzle throughout. For Ames, 10 hourly precipitation reports had measurable precipitation for the day. The featured chart checks in on the monthly total of such hourly reports of measurable precipitation. The 2025 total for May so far is still below the simple average for the month even with the 10 hours yesterday! Outside of March, the monthly totals for each month this year have been below average. We'll have a few more hours of precipitations today and perhaps that will be it for the month as much warmer weather finally returns to the state.
Voting: Good - 12 Bad - 0
Generate This Chart on Website
28 May 2025 05:30 AM
Tuesday was a rather dreary day with plenty of clouds and rain/drizzle throughout. For Ames, 10 hourly precipitation reports had measurable precipitation for the day. The featured chart checks in on the monthly total of such hourly reports of measurable precipitation. The 2025 total for May so far is still below the simple average for the month even with the 10 hours yesterday! Outside of March, the monthly totals for each month this year have been below average. We'll have a few more hours of precipitations today and perhaps that will be it for the month as much warmer weather finally returns to the state.
Voting: Good - 12 Bad - 0
Generate This Chart on Website
Thu May 29, 2025
1 May Tornado Warning
29 May 2025 05:30 AM
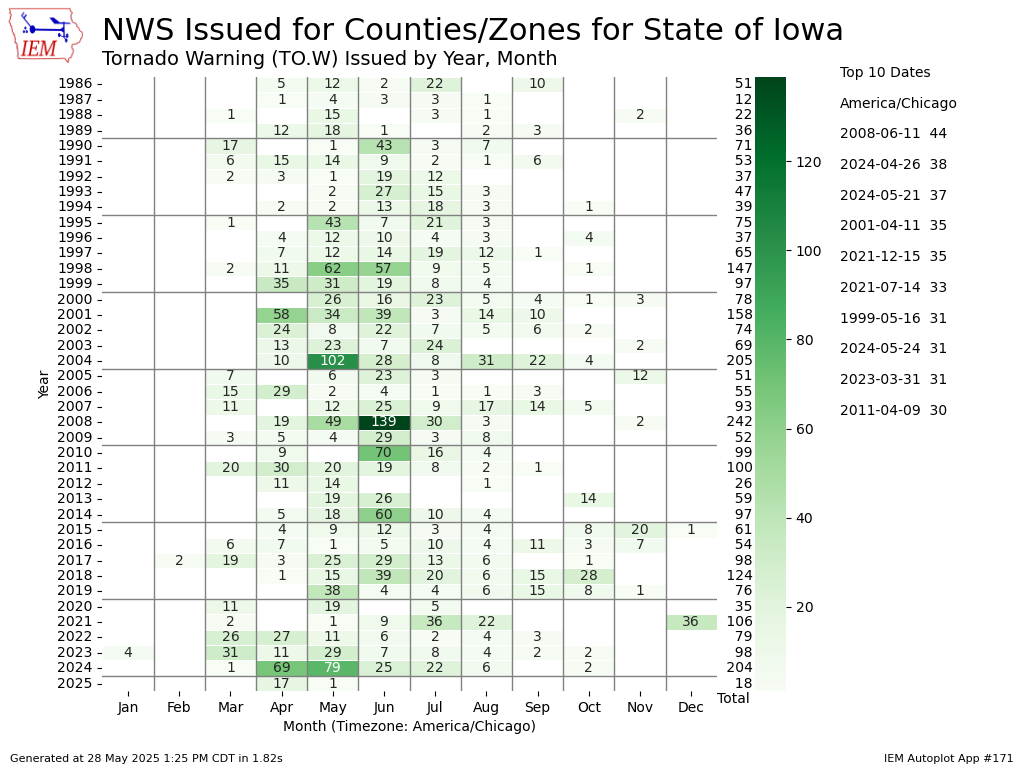
The last three days of May are forecast to have near no chance of severe weather and will wrap up a rather quiet month for such storms. The featured chart presents the IEM computed monthly NWS Tornado Warnings issued for Iowa since 1986. Only one such warning was issued this May and that was back on 20 May by NWS Davenport. The chart nicely shows that such a low count during May is not all that exceptional with it happening as recently as 2021 and a number of years previously. Heat and humidity do look to build going into June along with more robust chances of severe thunderstorms.
Voting: Good - 13 Bad - 0
Generate This Chart on Website
29 May 2025 05:30 AM
The last three days of May are forecast to have near no chance of severe weather and will wrap up a rather quiet month for such storms. The featured chart presents the IEM computed monthly NWS Tornado Warnings issued for Iowa since 1986. Only one such warning was issued this May and that was back on 20 May by NWS Davenport. The chart nicely shows that such a low count during May is not all that exceptional with it happening as recently as 2021 and a number of years previously. Heat and humidity do look to build going into June along with more robust chances of severe thunderstorms.
Voting: Good - 13 Bad - 0
Generate This Chart on Website
Fri May 30, 2025

June vs May Precip
30 May 2025 05:30 AM
Scattered Thursday afternoon showers did not add up to whole lot with most of the state staying dry. The IEM estimated areal-averaged precipitation total for Iowa this May will come in over in inch below average with only meager amounts expected through Saturday. Does a dry May portend a dry June? The featured chart looks into this comparing the same statewide monthly totals during those two months for a given year. A simple linear fit is shown with a slight positive trend, but little confidence with the correlation. The quadrant percentages would seem to indicate that having both months drier than average is the most common combination, but the contributing distributions are not normal with the larger tail on the heavier precipitation side skewing the average higher and thus more years in the below average classification. It is sort of interesting to note that the four wettest Junes were associated with below average Mays.
Voting: Good - 10 Bad - 0
Generate This Chart on Website