Iowa Atmospheric Observatory
Overview
The Iowa Atmospheric Observatory (IAO) was designed and constructed by Iowa State University under funding from the Iowa Power Fund and National Science Foundation Iowa EPSCoR grant (Grant # 1101284). This distributed observing facility is anchored by its two tall (120-m) towers, separated by 22 km, operating continuously since June 2016 in central Iowa. Tower A1 is located within a 200-turbine utility-scale wind farm, and Tower A2 is located in similar terrain and landscape but outside the same wind farm. Collocated at tower A2 since May 1, 2018, is a sodar wind profiler unit. In addition to the sodar, a surface meteorological station was also added to the A2 site on November 29, 2018. Various guest/collaboration sensors have been located at the sites as well. Associated short-term field research and teaching activities and their associated field observing facilities are deployed for specific short term intensive observing periods (IOPs) or longer term studies. Remote sensing instruments also have been and will be deployed for IOPs and continuously as new projects develop.
The agricultural landscape surrounding each tower is blocked out in one-mile (1.6 km) squares defined by public roads. The terrain is relatively flat (with elevation changes of about +/- 3 m per square mile), and the land-use is predominantly (~90%) intensely managed row crops, either corn (mature height 1.5-2.0 m) or soybeans (1.0 m) during the growing season. A few farmsteads of area of ~1 hectare (2-3 acres) dot the landscape (~1-2 per square mile) consisting of a few 1-2 story buildings surrounded by trees typically of height 5-10 m. Crops are planted in April-May and harvested in September-October. Outside this growing season the landscape is bare with some crop residue giving surface roughness elements (not zo) of ~ 5-8 cm. The A1 Tower has grass (height ~0.2-0.8 m) in the immediate vicinity (1 hectare) of the tower. A visible aerial image of the agricultural landscape surrounding the A2 Tower (Figure 1) reveals the homogeneity of surface. The tower is located on a rectangular crushed-rock area in the center of the image that is connected by a crushed-rock private road to a grid of public roads. The east-west roads at the top and bottom of the image are 1 mile apart.
Tower Locations
Story County tower (A1)
E911: 67527 110th St, Zearing, IA
Lat./Long: 42.19676N, 93.3572W
Hamilton County tower (A2)
E911: 3052 Xircus Ave., Ellsworth, IA
Lat./Long.: 42.34575N, 93.51945W
Period of Record
June 2016 to August 2021
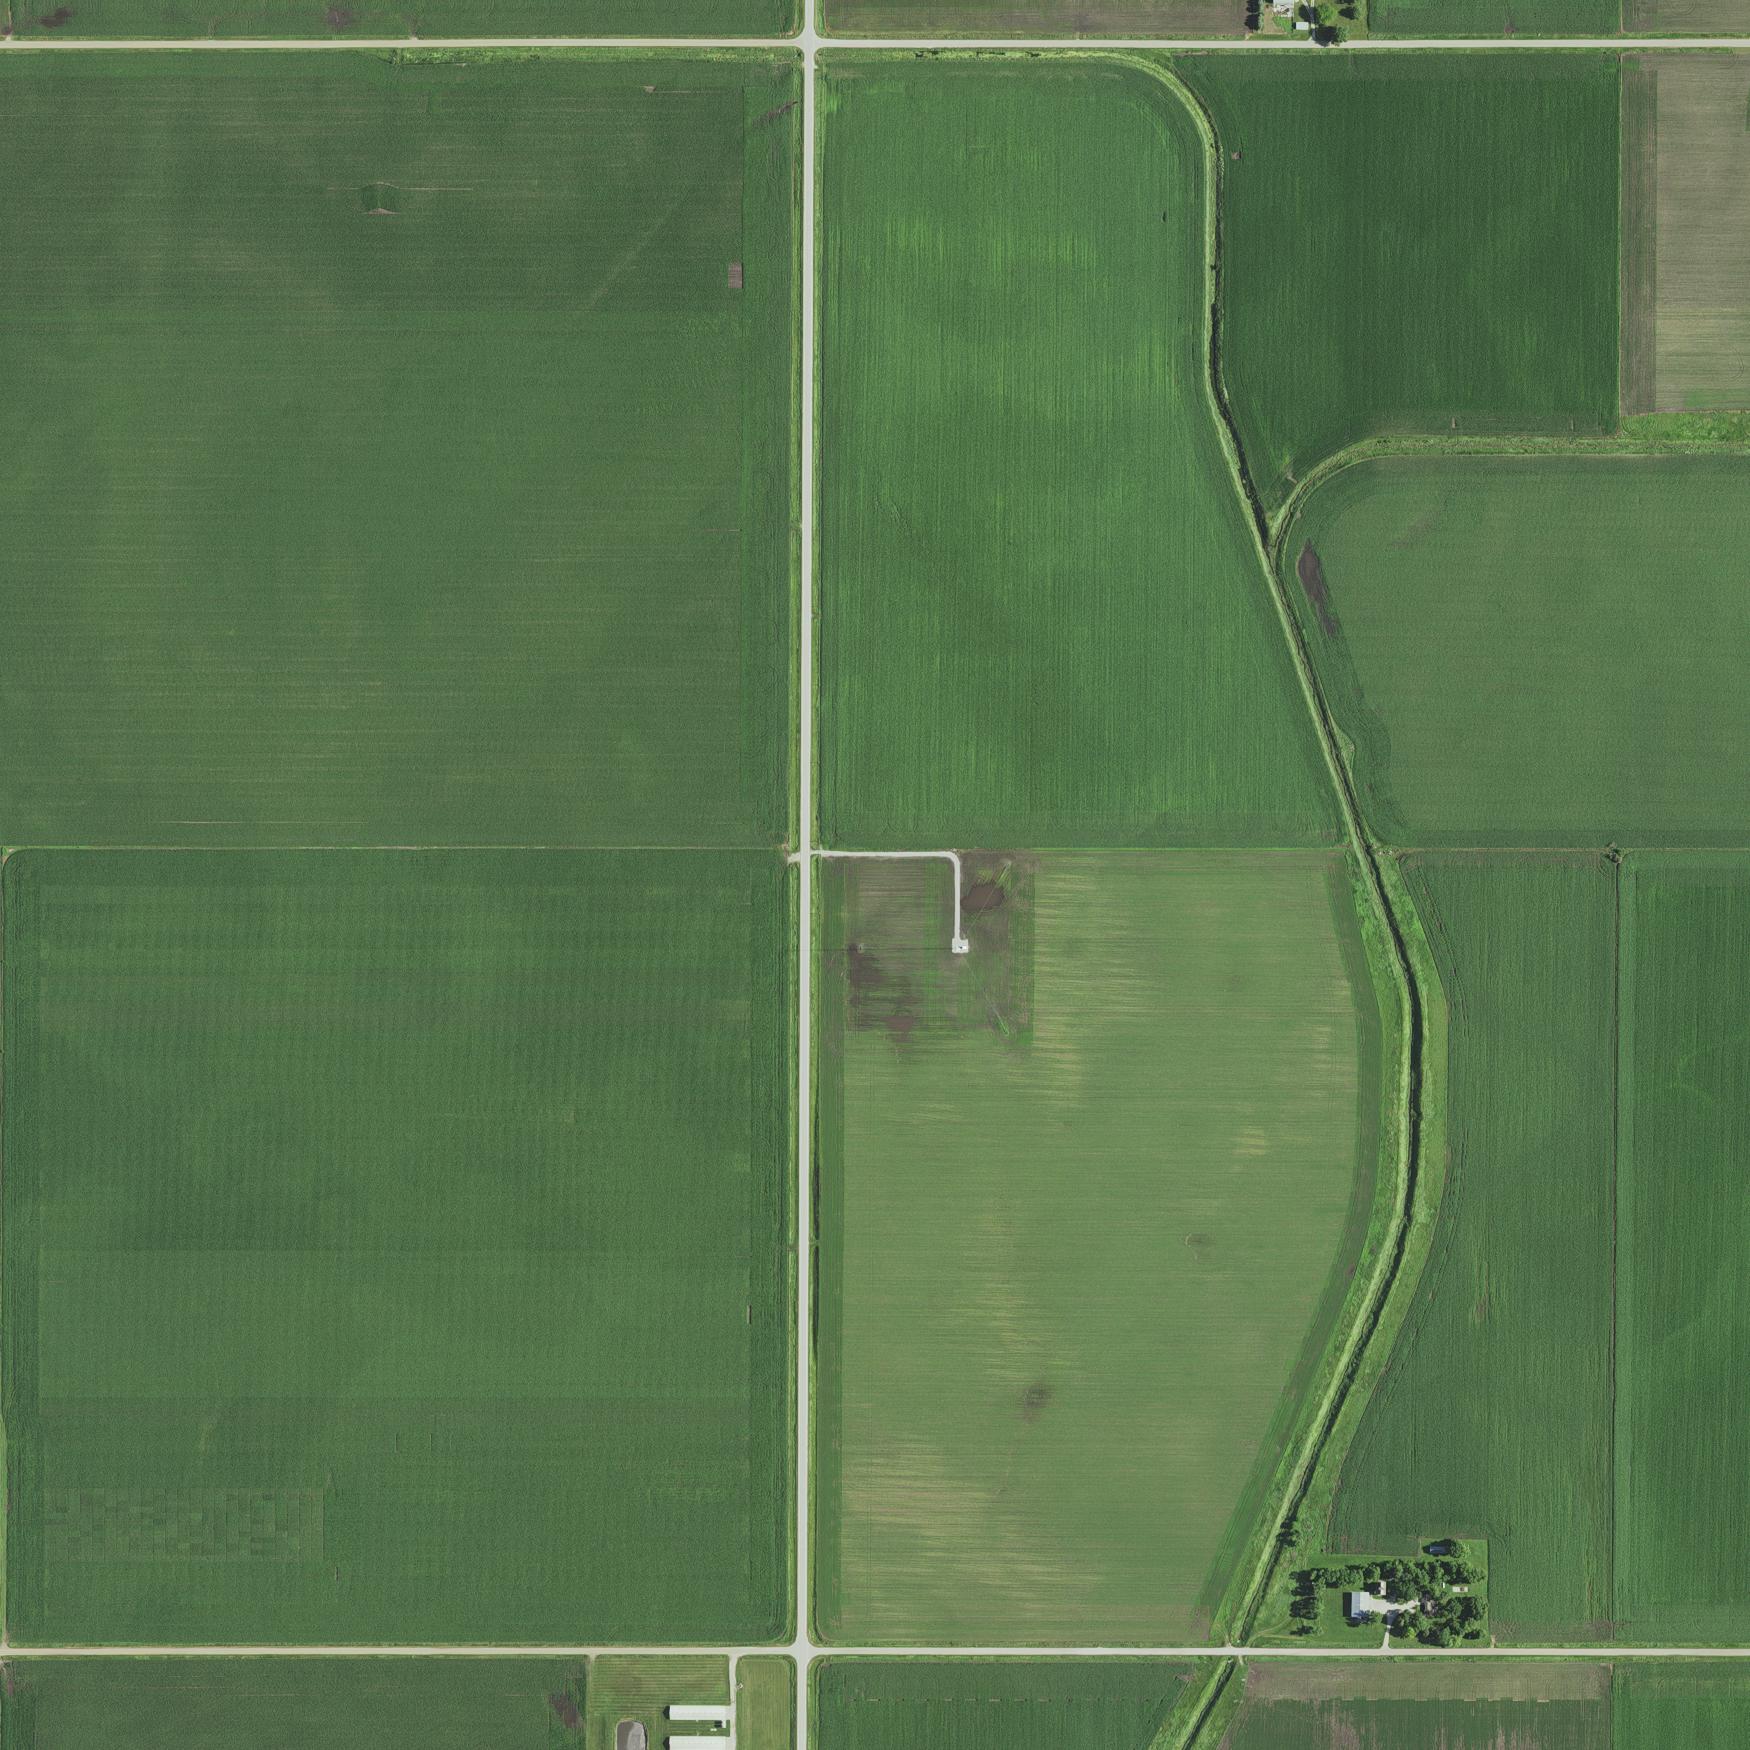
Figure 1: Arial photo of A2 tower site. Image courtesy of R. Doorenbos.
Photo source: Iowa NAIP 2017 Orthophotos. USDA-FSA-APFO Aerial Photography Field Office
Instruments
The two 120-m towers host identical profiles of instruments at levels of 5, 10, 20, 40, 80, and 120 m as shown in Figure 2. The towers are of a triangular lattice construction approximately 1 m on a side. Details of the instruments are listed in Table 1, and boom orientations and lengths, identical on both towers, are shown in Figure 3. Photos of the instruments and booms on the towers are shown in Figures 4a and 4b. Redundant wind speed and direction sensors at each level provide measurements with minimal tower interference for flow from prevailing wind directions at these sites, which are shown by the 10-m (Figure 5a) and 80-m (Figure 5b) wind roses from Tower A2. Orientation of booms and sensor locations along each boom are shown in Figure 5. Site photos (Figure 6) show the climate-controlled concrete sheds housing data acquisition and communication facilities at the base of each tower and the proximity of the A1 tower to nearby rows of turbines.
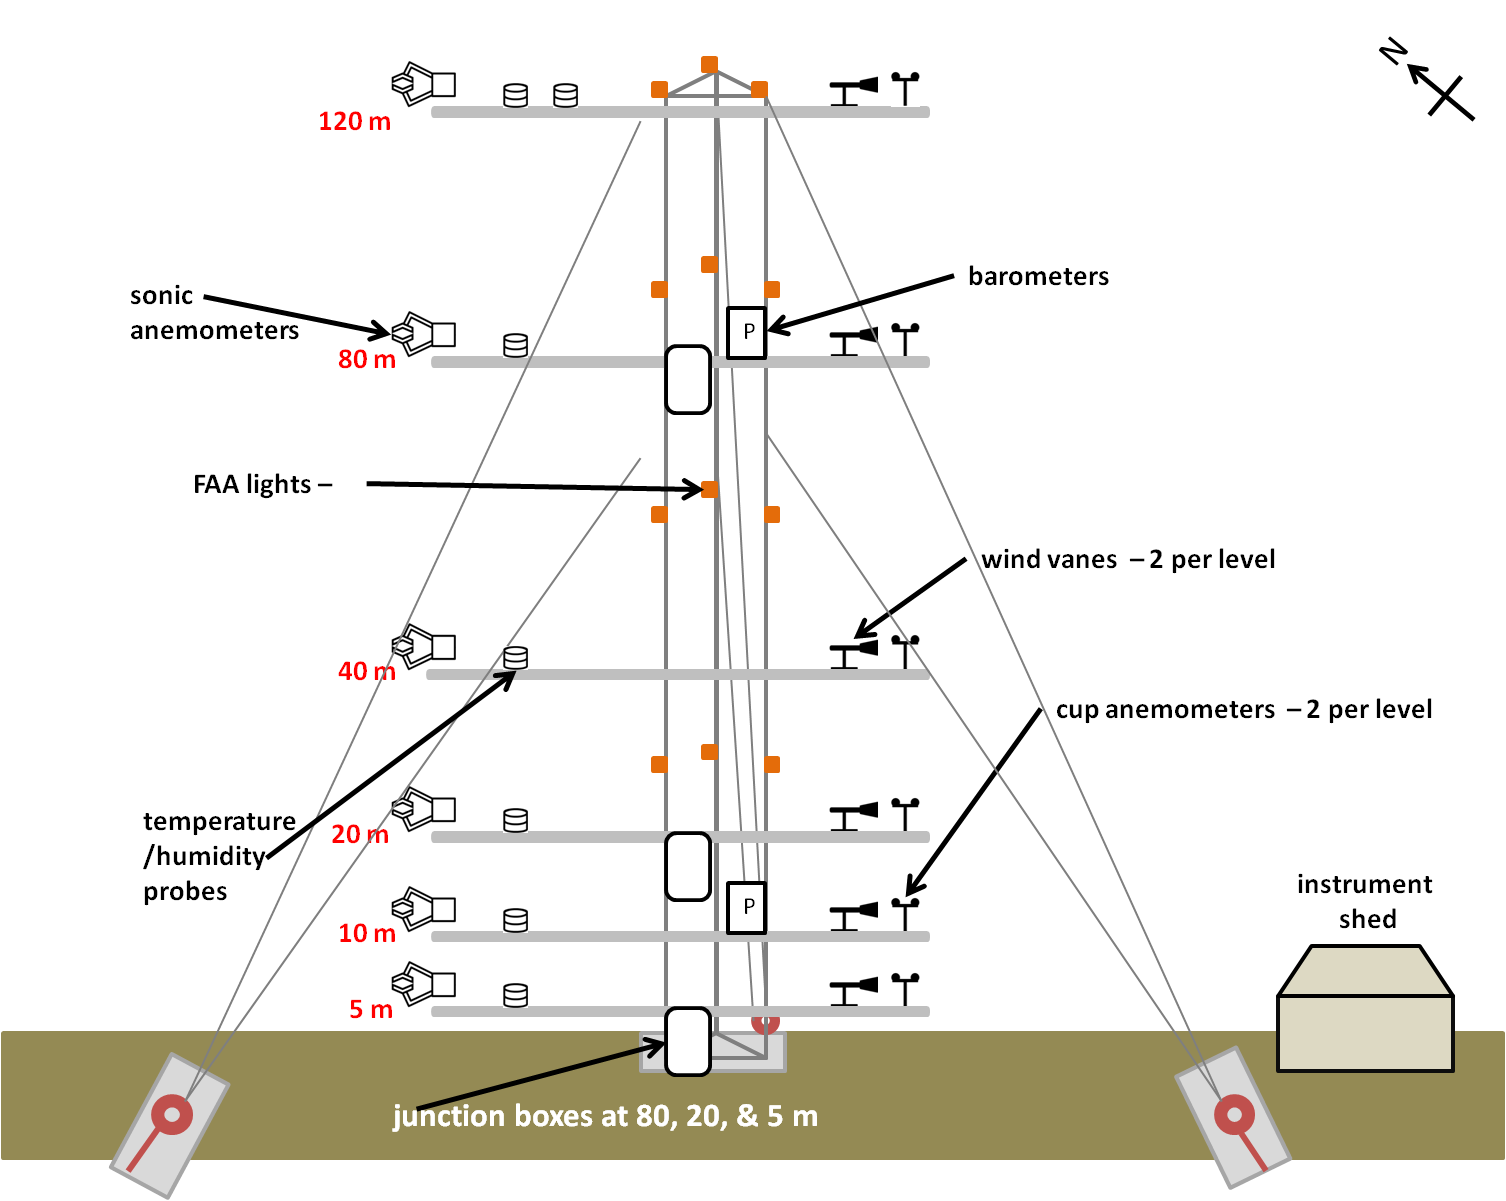
Figure 2: Profile of instruments
on each tall tower. Image courtesy of S. Purdy. Note: image is not to scale
and does not reflect actual setup of booms and instruments.
| Sensor description | Manufacturer | Height (m) | Distance from Tower | Operating Range | Measurement Accuracy |
|---|---|---|---|---|---|
|
Thies cup anemometerac Thies cup anemometerbc Thies cup anemometerbd |
Thies GmbH & Co. KG; Coesfeld, Germany |
120, 40, 10 80, 20, 5 120†, 80, 40, 20*, 10‡, 5 |
2.74 m§ | -50 to 80 °C | ±0.2 m s-1 from 0.3 to 50 m s-1 or 1% |
| NRG 200P wind vaneed | Renewable NRG Systems; Hinesburg, Vermont, USA | 120, 80, 40, 20, 10‡, 5 | 1.83 m§ (0.91 m from cup anemometer) | -55 to 60 °C | ±1% |
| H2SC3 temperature/relative humidity probee | Campbell Scientific; Logan, Utah, USA | 120, 80, 40, 20, 10, 5 | 1.22 m (0.61 m from wind vane) [Duplicate probes at 120 m with 0.61 m spacing] | -40 to 60 °C | T: ±0.1 °C at 23°C ±0.2 °C at 0°C & 40°C RH: 0.8% at 20°C, 1.3% at 0°C & 40°C |
| CSAT3B sonic anemometerc | Campbell Scientific; Logan, Utah, USA | 120†, 80, 40, 20, 10‡, 5 | 2.74 m | -30 to 50 °C | u,v: 1 mm s-1 (rms) w: 0.5 mm s-1 (rms) T: ±0.002 °C (rms) at 25 °C a: < 0.058° at u=v=1 m s-1 |
| PTB 110 barometerf | Vaisala Helsinki, Finland | 80, 10 | 0 m (mounted on tower legs) | -55 to 60 °C | ± 0.3 mb at 20 °C ± 0.6 mb at 0 °C & 40 °C |
Table 1 Instruments deployed at A1 and A2 with sensor operating range and measurement accuracy. a heated cup anemometer, b unheated cup anemometer, c WNW boom, d S boom, e WSW boom, f N leg of tower, § vertical distance from midpoint of sensor to boom is 0.41m, † sensor at A2 replaced previous sensor on 16 August 2016, ‡ sensor at A2 replaced previous sensor on 16 February 2017, * rotor cup assembly at A2 replaced 23 May 2016.

Figure 3: Diagram of boom orientation, length, and
placement of sensors on each tower. Image courtesy of S. Purdy,
D. Rajewski, and E. Takle. Note: image not to scale.


Figure 4: Orientation of sensors along booms at the A1 tower (a) looking south from tower base and b) looking up from tower base. Image courtesy of S. Purdy.

Figure 5a: 10-m wind rose at A2 tower from June 2016-May 2017. Image courtesy of: D. Rajewski

Figure 5b: 80-m wind rose at A2 tower from June 2016-May 2017. Image courtesy of: D. Rajewski


Figure 6: Site overview of tall tower and instrument shed at each tower site: A1 within the wind farm (a) and A2 outside of the wind farm (b). Images courtesy of S. Purdy.
Topography and Tower Mast Influences on IAO Measurements
Terrain for both sites is flat with about 13m higher elevation at A2 vs. A1 (356.6 m vs. 343.8 m). Within 1 km of A1 the land slopes gently upward (≤1.0%) to the south, southwest, west, northwest, and north of the tower. Surrounding A2 slopes within 1 km of the tower are ±0.1% to the south, southwest, west, and northwest of the tower and -0.3% to the north of the tower. Both sites feature slopes that vary radially away from the tower at rates of less than ±0.7% within a 4-km distance of each tower for each of the following directions [A1 vs A2] S: -0.3% vs. -0.2%; W: <-0.1% vs. -0.2%.; N: <0.1% vs. 0%; E: <0.1% vs. <0.1%. These topographical variations are significantly lower than the requirements for site calibration of met towers near wind turbines (e.g. <10% slope or height variations of ±4m from the horizontal plane at a distance of 16 rotor diameters, D (D=82m) from a turbine (IEC61400-12:1, 2005)).
Influence of tower cross section on our measurements is shown in Figure 7 by taking the ratio of median wind speeds from the WNW and S IAO Tower booms for 80-m wind direction from the A2 reference tower. From wind directions approximately S (172.5°) to approximately NW (326.5°) we expect less than 5% variation in anemometer speeds due to the tower influence. For easterly and northerly wind, the WNW and S anemometer speeds depart by 30-40% depending on the leeward or windward position of each anemometer. Higher variability of the normalized speed is indicated at the 10-m and 120-m levels due to cup anemometer malfunction on the south boom before instrument repair in August 2016. We also observe a slight reduction in the tower wake at 5-m for easterly wind which we attribute to the flow interference from the 2.5-m tall equipment shed. At 20 m and above the tower shadow is the dominant influence on the waked region.

Figure 7: Detection of tower wake at all tower levels
from normalized wind
speed ratios from the WNW and S booms. Median ratios are represented with
median absolute deviations as error bars and error bars are plotted every
15°. A2 80-m wind direction is taken from the wind vane on the WNW
boom. Tower
boom layout diagram denotes usable wind directions from No Wake sector.
Image courtesy of: D. Rajewski
Remote sensors and surface met station
Measurements from wind profiling systems complement understanding of low-level stability and turbulence measurements from the tall towers. A sodar was installed 140 m northeast of A2 May 1, 2018 (Figures 8a and 8b). A lidar was also positioned near the base of the A2 tower in May 2018. Horizontal and vertical wind speed, wind direction, turbulence intensity, and data quality are monitored at ten heights from 40 m to 200 m every ten minutes from both the lidar and sodar.
A hyperspectral and infrared camera were installed on the A2 tower at 80 m during the 2018 growing season to monitor field-scale variations in crop water use and plant photosynthetic activity. A surface met station (Figure 9) was installed 10 m southwest of the A2 tower base in September 2018 and consists of a tripod mast with sensors for 2 m air temperature and relative humidity, 2 m wind speed and wind direction, 2 m pressure, incoming solar radiation, and precipitation.

Figure 8: Sodar wind profiler in the vicinity of the A2
tower during the 2018 growing season (a) and after harvest (b).
Images courtesy of S. Purdy.

Figure 9: Surface meteorology station near the A2
tower base after the 2018 growing season. Image courtesy of S. Purdy.
Tower Data
Two continuous data streams from the towers operate at different sampling rates. Temperature, relative humidity, horizontal wind speed, wind direction, and pressure are reported and archived a 1-Hz, while 3-component wind speed and virtual temperature are reported at 20-Hz by sonic anemometers. Archives of the continuous record of the 1-Hz data began in June 2016. Data were recorded episodically from the sonic anemometers starting November 2016.
One-minute average plots from select data streams for last 36 hours are available at:
https://talltowers.agron.iastate.edu/plots/
A simple plotting tool is available to display and download limited time periods of data:
here
Find data and additional documentation about the datasets at the IAO data archive.
Crop/Wind-energy Experiment (CWEX)
A series of field experiments was conducted in advance of construction of the tall towers from 2009-2013 in the vicinity of the tower locations taking advantage of their proximity to a 200-turbine utility-scale wind farm. More details of the field sites, observing facilities, data archives and scientific results can be found in the publications and presentations listed below.
Contact Information
For information on the IAO facilities contact E. S. Takle ( gstakle@iastate.edu)
Acknowledgements
The IAO towers and associated instrumentation were funded by an NSF/EPSCoR grant to the state of Iowa (Grant #1101284) and a follow-on NSF/AGS grant #1701278. An Opportunity Grant (#OG-17-001) from the Iowa Energy Center provided bridge funding that supported research contributing to the success of the follow-on proposal to NSF. Any opinions, findings, and conclusions or recommendations expressed in publications resulting from the bridge funding are those of the authors and do not necessarily reflect the views of the Iowa Energy Center.
Partial support for this research was also provided by the NSF ISU Wind-Energy Science, Engineering and Policy IGERT grant (1069283), Howard Hughes Medical Institute grant, Pioneer Hi-Bred Professorship in Agronomy, and the USDA-NIFA Hatch Project IOWA4414.
Funding from seed grants from the Ames Laboratory/USDOE and the Center for Global and Regional Environmental Research, together with in-kind contributions for pre-construction exploratory research were provided by the National Renewable Energy Laboratory and the University of Colorado (J. Lundquist), the National Laboratory for Agriculture and the Environment, and the National Center for Atmospheric Research. These contributions made possible the Crop/Wind-energy Experiments (CWEX-10, CWEX-11, CWEX-12, and CWEX-13) that laid the scientific basis for the concept of the IAO.
Publications from the Crop/Wind-energy Experiments and the Iowa Atmospheric Observatory
Takle, E. S., 2017: Climate. In M. Perrow, ed., 2017: Wildlife and Wind Farms – Conflicts and Solutions. Volume I. Onshore Potential Effects. Pelagic Publishing. 298 pp. ISBN 9781784271190.
Takle, E. S., D. A Rajewski, and S. I. Purdy, 2017: The Iowa Atmospheric Observatory: Revealing the unique boundary-layer characteristics of a wind farm. Earth Interactions in review
Rajewski, Daniel A., Eugene S. Takle, John H. Prueger, and Russell K. Doorenbos, 2016: Toward understanding the physical link between turbines and microclimate impacts from in situ measurements in a large wind farm. J. Geophys. Res. Atmos., 121, doi:10.1002/2016JD025297
Vanderwende, Brian J., Julie K. Lundquist, Michael E. Rhodes, Eugene S. Takle, and Samantha Irvin, 2015: Observing and simulating the summertime low-level jet in central Iowa. Mon. Wea. Rev., 143, 2319-2339.
Takle, E S., D. A. Rajewski, J. K. Lundquist, W. A. Gallus, Jr., and A. Sharma, 2014: Measurements in support of wind farm simulations and power forecasts: The Crop/Wind-energy Experiments (CWEX). The Science of Making Torque From Wind, 2014. Journal of Physics: Conference Series, 524 (2014) 012174 doi:10.1088/1742-6596/524/1/012174.
Lundquist, Julie K., Eugene S. Takle, Matthieu Boquet, Branko Kosović, Michael E. Rhodes, Daniel Rajewski, Russell Doorenbos, Samantha Irvin, Matthew L. Aitken, Katja Friedrich, Paul T. Quelet, Jiwan Rana, Clara St. Martin, Brian Vanderwende, and Rochelle Worsnop, 2014: Lidar observations of interacting wind turbine wakes in an onshore wind farm. The Science of Making Torque From Wind, 2014. Available online.
Rajewski, D.A., Eugene S. Takle, Julie K. Lundquist, John H. Prueger, Michael E. Rhodes, Richard Pfeiffer, Jerry L. Hatfield, Kristopher K. Spoth, Russell K. Doorenbos, 2014: Changes in fluxes of heat, H2O, and CO2 caused by a large wind farm. Agric. and For. Meteor., 194, 175-187. DOI: 10.1016/j.agrformet.2014.03.023
Rajewski, D. A., Eugene S. Takle, Julie K. Lundquist, Steven Oncley, John H. Prueger, Thomas W. Horst, Michael E. Rhodes, Richard Pfeiffer, Jerry L. Hatfield, Kristopher K. Spoth, and Russell K. Doorenbos, 2013: CWEX: Crop/Wind-energy Experiment: Observations of surface-layer, boundary-layer and mesoscale interactions with a wind farm. Bull. Amer. Meteor. Soc., 94, 655-672. doi: 10.1175/BAMS-D-11-00240
Presentations from the Crop/Wind-energy Experiments and the Iowa Atmospheric Observatory
18. Takle, E. S., R. A. Rajewski, S. L. Purdy, J. Sun, and S. Zilitinkevich, 2017: Exchanges to surface and boundary layer reconsidered: Introducing FaNTASTIC-1. International Conference on Future Technologies for Wind Energy. Boulder CO, October 2017. [Available PDF]
17. Rajewski, D. A., E. S. Takle, and S. L. Purdy, 2017: Tall tower measurements of wake loss characteristics within a low-density wind farm. International Conference on Future Technologies for Wind Energy. Boulder CO, October 2017. [Available PDF]
16. Takle, Eugene S., Daryl Herzmann, and Dan Rajewski, 2016: Wind-farm power production diagnostic tools with applications to wake steering. Invited presentation. National Renewable Energy Laboratory (DOE), Boulder CO. [Available PDF]
15. Takle, Eugene S., Daryl Herzmann, and Dan Rajewski, 2016: Power-production diagnostic tools for low-density wind farms with applications to wake steering. Amer. Geophys Union Fall Meeting. San Francisco. December
14. Takle, E. S., 2017: Wind Energy: An outdoor laboratory has been established to collect reliable wind speed and turbulence data for use with computational models of wind turbine systems. Poster displayed at the EPSCoR Legislator Breakfast at the Iowa Statehouse.
13. Takle, E. S., D. A. Rajewski, and S. L. Irvin, 2017: Identical twin towers for studies of natural turbuence and wind farm boundary layers. 8th Conf. on Wea., Climate, Water and the New Energy Economy, 23 Jan., Amer. Meteor. Soc., Seattle, WA.
12. Rajewski, Daniel A., Eugene S. Takle, Julie K. Lundquist, Samantha L. Irvin, and Russell K. Doorenbos, 2015: Spatial characteristics of power variability from a large wind farm in Iowa during the 2013 Crop/Wind Energy Experiment (CWEX-13). Sixth Conference on Weather, Climate, and the New Energy Economy. American Meteorological Society. Phoenix, AZ
11. Lundquist, Julie K., E. S. Takle, M. Boquet, B. Kosovic, M. E. Rhodes, D. A. Rajewski, R. K. Doorenbos, S. Irvin, M. Aitken, K. Friedrich, P. T. Quelet, J. Rana, C. St. Martin, B. J. Vanderwende, and R. Worsnop, 2014: Lidar observations of the variation of wind turbine wakes with inflow conditions in an onshore wind farm. 21st Symposium on Boundary Layers and Turbulence. American Meteorological Society. Leeds, UK.
10. Lundquist, J. K., E.S. Takle, M. Boquet, B. Kosovic, M.E. Rhodes, D. Rajewski, R. Doorenboos, S. Irvin, M.L. Aitken, K. Friedrich, P.T. Quelet, J. Rana, C. St. Martin, B. Vanderwende, W. Rochelle, Lidar observations of interacting wind turbine wakes in an onshore wind farm, European Wind Energy Association 2014. (2014) 33–36.
9. Selvaraj, S., A. Chaves, E. Takle and A. Sharma, “Numerical Prediction of Surface Flow Convergence Phenomenon in Windfarms” in Proc. of the Conference on Wind Energy Science and Technology, RUZGEM, Ankara, Turkey, Oct 3-4, 2013.
8. Rajewski, D. A., E. S. Takle, J. H. Prueger, S. Oncley, J. K. Lundquist, T. W. Horst, M. E. Rhodes, R. L. Pfeiffer, J. L. Hatfield, K. K. Spoth, and R. Doorenbos, 2013: Wind Turbine Wake Investigation from Surface Measurements during the 2010 and 2011 Crop Wind-Energy EXperiments (CWEX-10/11). Fourth Conference on Weather, Climate, and the New Energy Economy. American Meteorological Society. Austin, TX.
7. Takle, E. S., D. A. Rajewski, J. Prueger, Steven Oncley, J. K. Lundquist, Thomas W. Horst, Michael E. Rhodes, Richard Pfeiffer, Jerry L. Hatfield, Kristopher K. Spoth, Russell K. Doorenbos, 2013: CWEX-10/11: Overview of Results From the First Two Crop/Wind-Energy Experiments. Fourth Conference on Weather, Climate, and the New Energy Economy. American Meteorological Society. Austin, TX.
6. Takle, E. S., D. A. Rajewski, J. Prueger, Steven Oncley, J. K. Lundquist, Thomas W. Horst, Michael E. Rhodes, Richard Pfeiffer, Jerry L. Hatfield, Kristopher K. Spoth, Russell K. Doorenbos, 2012: CWEX-10/11: Overview of Results From the First Two Crop/Wind-Energy Experiments. American Geophysical Union Fall Meeting, San Francisco.
5. Rajewski, D. A., E. S. Takle, J. H. Prueger, S.P. Oncley, T. W. Horst, R. Pfeiffer, J. L. Hatfield, K. K. Spoth, R.K. Doorenbos, 2012: Evaluation of surface energy and carbon fluxes within a large wind farm during the CWEX-10/11 Crop Wind-Energy eXperiments. American Geophysical Union Fall Meeting, San Francisco.
4. Rajewski, D. R., E. S. Takle, T. W. Horst, S. P. Oncley, J.K. Lundquist, M. E. Rhodes, and K. K. Spoth, 2012: Crop-Wind-Energy Experiment 2011 (CWEX11). 16th Symposium on Meteorological Observation and Instrumentation. Amer. Meteorol. Soc. 23-26 Janurary. New Orleans.
3. Takle, E. S., D. A. Rajewski, J. H. Prueger, J. K. Lundquist, M. Aitken, M. E. Rhodes, A. J. Deppe, F. E. Goodman, K. C. Carter, L. Mattison, S. L. Rabideau, A. J. Rosenberg, C. L. Whitfield, and J. Hatfield, 2010: Wind and flux measurements in a windfarm co-located with agricultural production. Presented at the American Geophysical Union Fall Meeting, San Francisco. (Invited presentation)
2. Rhodes, M. E., , M. L. Aitken, J. K. Lundquist, E. S. Takle, and J. Prueger, 2010: Effect of wind turbine wakes on cropland surface fluxes in the US Great Plains during a Nocturnal Low Level Jet. Presented at the American Geophysical Union Fall Meeting, San Francisco.
1. Takle, E. S., D. A. Rajewski, M. Segal, R. Elmore, J. Hatfield, J. H. Prueger, and S. E. Taylor, 2009: Interaction of turbine-generated turbulence with agricultural crops: conceptual framework and prelimnary results. Presentation at American Geophysical Union Fall Meeting, San Francisco.