IEM Daily Feature
Friday, 23 May 2025
Friday, 23 May 2025
Boone County Corn Yields
Posted: 23 May 2025 05:30 AM
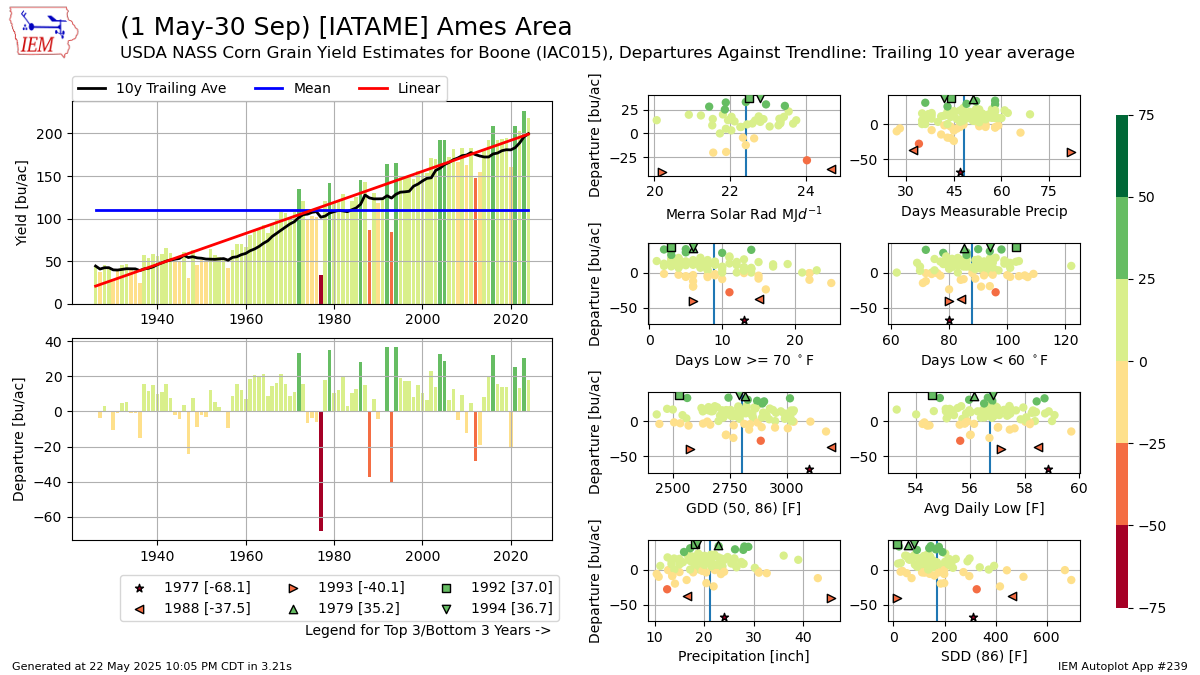
With USDA NASS's recent release of 2024 county corn yield estimates, it is a good time to plot up a bit of a deep dive comparing yearly yields and weather metrics. The featured chart combines the Boone County NASS corn yields with the long term Ames climate site data. As as aside, while Ames is mostly in Story County, the long term climate site was at the research farm west of town in Boone County for a good chunk of the period of record data. The top left panel shows the yearly yield values along with a linear trend line, trailing 10 year average, and simple mean plotted. The lower left panel plots the yearly departure against the 10 year trend line. The three worst and three best years against the trend are assigned special markers for the right side eight panels presenting various weather metrics between 1 May and 30 September. The bottom two right side panels tell a good story with too little and too much precipitation being negative for corn yields along with increasing Stress Degree Days (SDD)s decreasing yields. Of course, there is no magic metric between weather variables and corn yields, but it is certainly fun to play around with the data and see if you can spot any trends. You can follow the "generate this chart" link and generate more charts like this for your periods and location of choice.
Voting:
Good = 12
Bad = 0
Tags: corn
Voting:
Good = 12
Bad = 0
Tags: corn