Automated Data Plotter
This application dynamically generates many types of graphs derived from various IEM data sources. Feel free to use these generated graphics in whatever way you wish.
1 Select a Chart Type
2 Configure Chart Options
Plot Description:
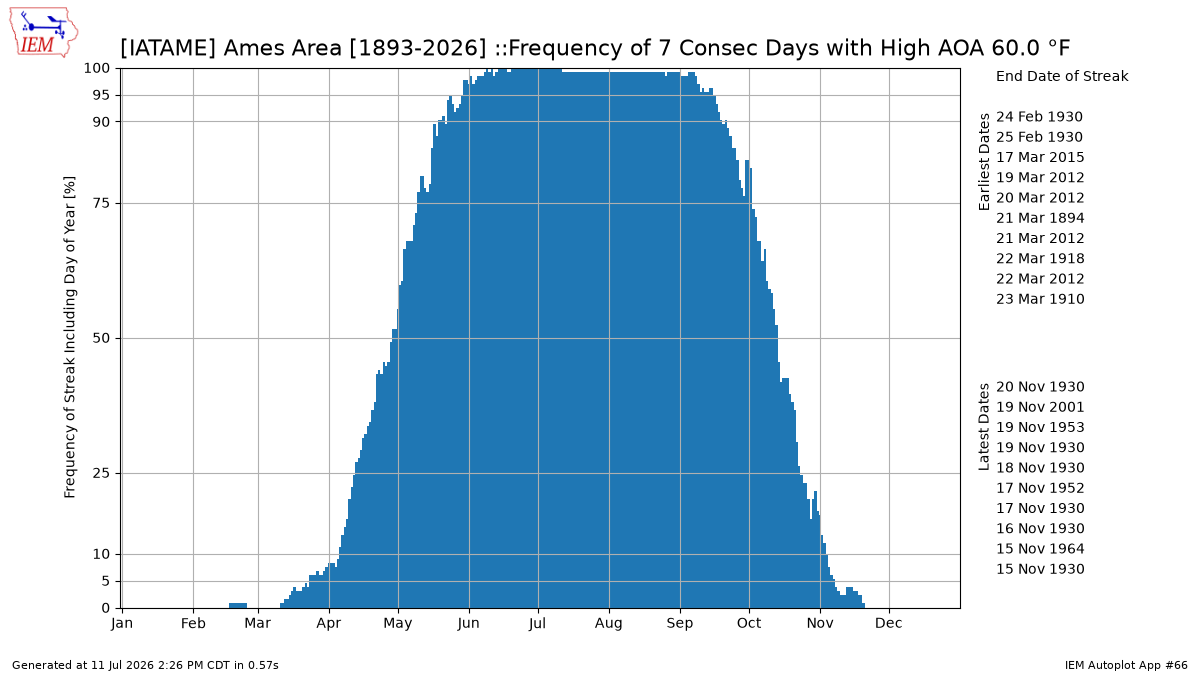
This chart presents the daily frequency of the given date having the prescribed number of previous days above or below some provided treshold. Autoplot 216 provides actual streaks and yearly maximum values.The accumulated precipitation metric is for an inclusive number of trailing days evaluated at that given day, so there is not double accounting for days that participate in a trailing day period that ended in the future. Rewording, an example frequency of 25% of May 1 would indicate that on that date, it had an inclusive trailing number of days accumulation above or below the choosen threshold.
2 Oct 2023: The plotting logic was updated to plot the frequency of a given day participating in a streak, rather than the frequency of a streak ending on that day. This should be a more useful metric for the user.
3 Generated Chart
Based on recent timings, plot generation averages 2 seconds. Please wait while your chart is being generated...
IEM Daily Features using this plot
The IEM Daily Features found on this website often utilize plots found on this application. Here is a listing of features referencing this plot type.
- 29 May 2026: Four Days of 90+°F
- 16 Feb 2026: Six Days of 60+°F
- 30 Sep 2025: Eight Days of 84+°F Highs
- 09 Dec 2024: Two Days of 60+
- 17 Sep 2024: 12 Days of 80+
- 18 Jun 2024: Five Days with 70+ Lows
- 13 Nov 2023: 5 Days of 65+
- 29 Sep 2023: Late for Two Days of 90+
- 24 Oct 2022: Two Days of 83+
- 14 May 2022: Early for 90s Streak
- 27 Sep 2021: Five Days of 80+
- 22 Apr 2021: Four Straight Days below 32
- 05 Nov 2020: Going for Six Days of 70+
- 10 Sep 2020: Three Straight Sub 60
- 23 Jul 2020: Three Days of 90+
- 17 Jan 2019: Seven Straight below Freezing
- 15 Mar 2017: Six Days Below Freezing
- 08 Mar 2016: Three days of 70+
- 08 Dec 2015: Five Days of 50+
- 28 Oct 2015: 3 Days of 60+
- 12 Mar 2015: Seven Days of 60+