Automated Data Plotter
This application dynamically generates many types of graphs derived from various IEM data sources. Feel free to use these generated graphics in whatever way you wish.
1 Select a Chart Type
2 Configure Chart Options
Plot Description:
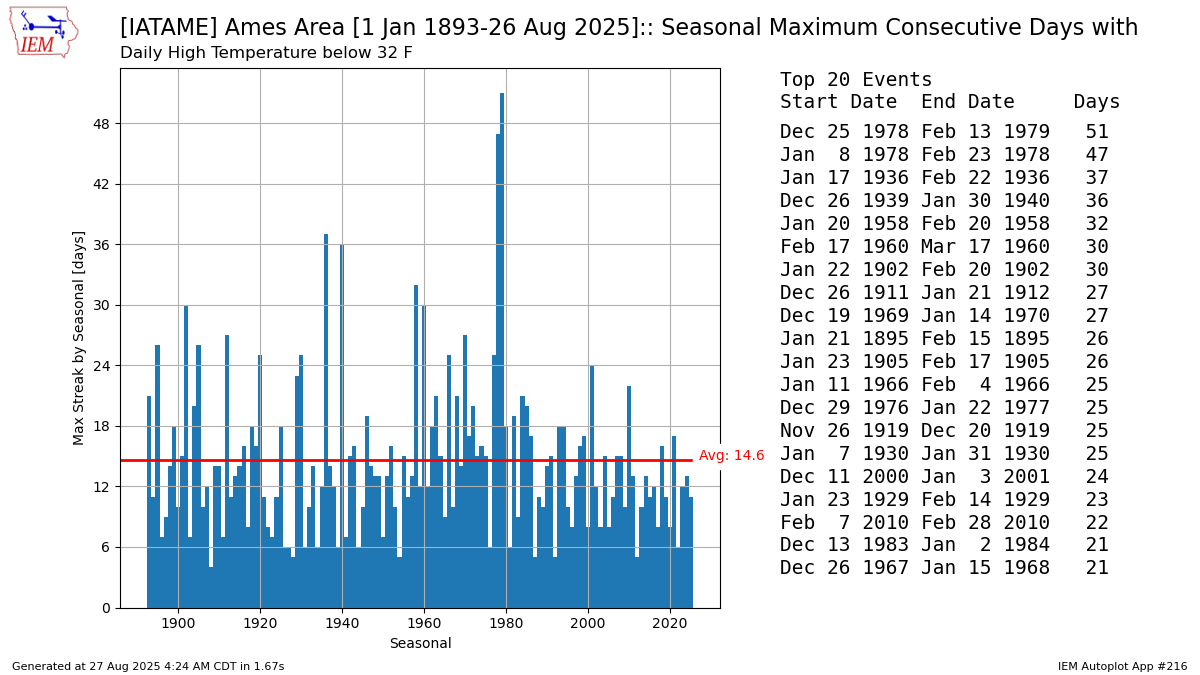
This chart presents the longest daily streaks of having some threshold meet. This tool presents a number of variables that may not be observed by your station or network. If you pick a below threshold, then the year is split on 1 July and the year plotted is the year of the second half of that period. Daily Data Request Form provides the raw values for the automated stations. The download portal for the long term climate sites is here.3 Generated Chart
Based on recent timings, plot generation averages 4 seconds. Please wait while your chart is being generated...
If you notice plotting issues with the image above, please
contact us
and provide the URL address currently shown by your web browser.
IEM Daily Features using this plot
The IEM Daily Features found on this website often utilize plots found on this application. Here is a listing of features referencing this plot type.
- 06 Feb 2026: Frozen Days Streak
- 22 Aug 2025: 72 Straight at or above 60
- 22 Jul 2025: Third Day of 75+ Dew Points
- 09 Oct 2023: At Or Above 70 Record
- 25 Aug 2023: Waterloo Second Day 103+
- 24 Mar 2023: Ames Sub-60 Streak
- 12 Sep 2022: 100 days of 50 and above
- 23 Feb 2021: Streaks below 10
- 28 Jan 2011: Streaks below freezing