Automated Data Plotter
This application dynamically generates many types of graphs derived from various IEM data sources. Feel free to use these generated graphics in whatever way you wish.
1 Select a Chart Type
2 Configure Chart Options
Plot Description:
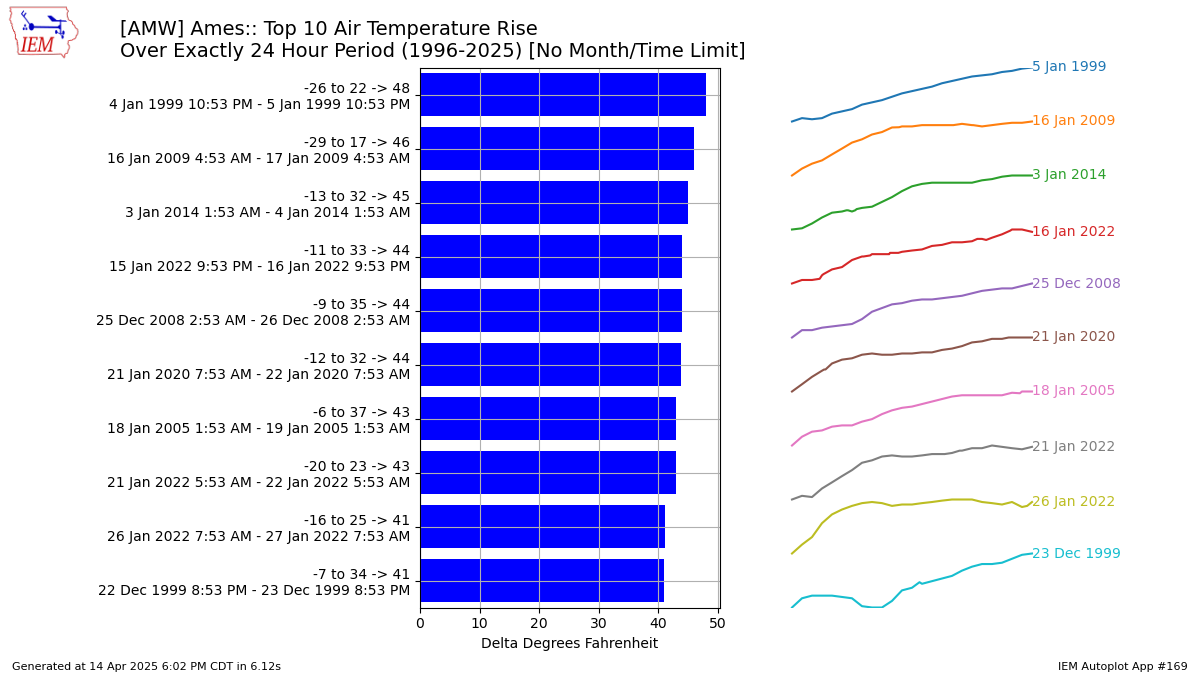
This chart presents the largest change in some observed variable over a given number of hours. This is based on available reports. There are two options for how to compute the change over a given window.| Label | Description |
|---|---|
| Compute at ends of time window | This requires an exact match between the starting timestamp and ending timestamp of the given window of time. For example, computing a 12 hour change between exactly 6:53 AM and 6:53 PM. |
| Compute over time window | This is more forgiving and considers the observation at the start of the window and then any subsequent observation over the window of time. The end of the window is inclusive as well. |
Note: This app is very effective at finding bad data points as the spark-line plot of the data for the given period will look flakey.
Autoplot 139 is similar to this plot, but only considers a calendar day.
3 Generated Chart
Based on recent timings, plot generation averages 31 seconds. Please wait while your chart is being generated...

If you notice plotting issues with the image above, please
contact us
and provide the URL address currently shown by your web browser.
IEM Daily Features using this plot
The IEM Daily Features found on this website often utilize plots found on this application. Here is a listing of features referencing this plot type.
- 24 Feb 2025: 58 Degrees Warmer
- 28 Feb 2024: Extreme Six Hour Drop
- 27 Jan 2022: Largest 12 Hour Rises
- 24 Jun 2021: 36 Hour Temperature Change
- 04 Jul 2019: July Temperature Drops
- 22 Nov 2016: Largest 6 Hour Drops