Automated Data Plotter
This application dynamically generates many types of graphs derived from various IEM data sources. Feel free to use these generated graphics in whatever way you wish.
1 Select a Chart Type
2 Configure Chart Options
Plot Description:
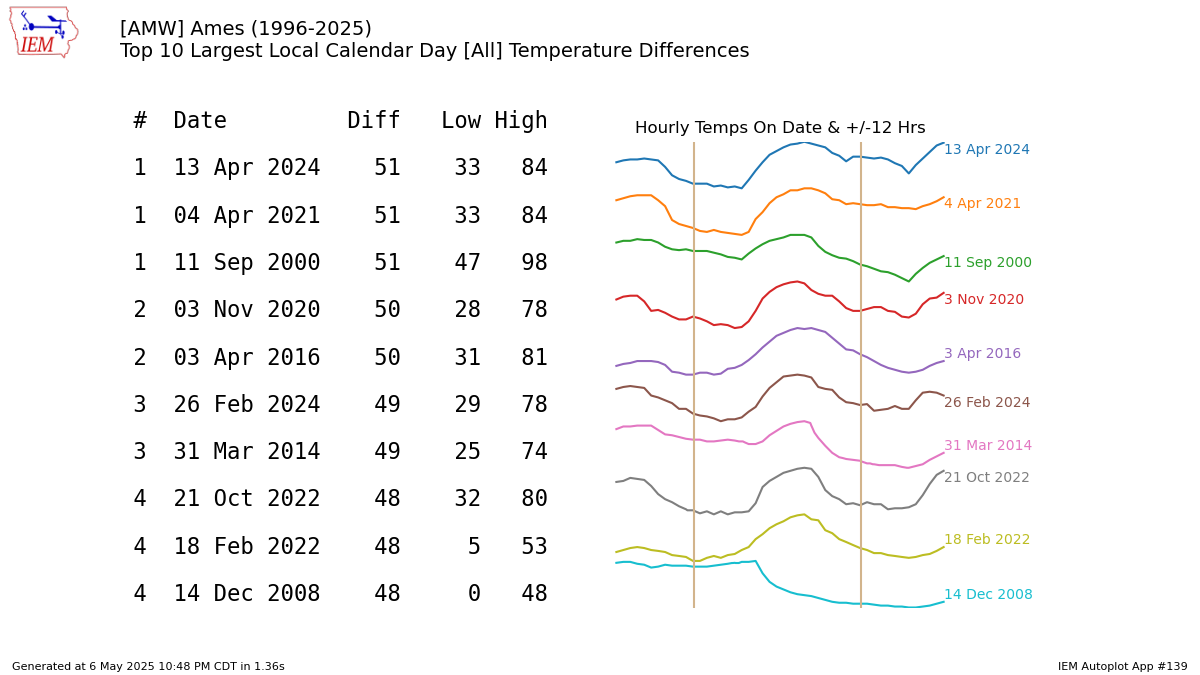
This table presents the 10 largest or smallest differences between the lowest and highest air temperature for a local calendar day. Some stations have auxillary products that provide 'daily' values over a date defined always in standard time. This plot also presents sprites of the temperature time series starting at 12 hours before the denoted date and ending at 12 hours after the date. The sprite often quickly points out bad data points, sigh, but also easily shows if the temperature change was an increase during the day or decrease.Autoplot 169 is similar to this plot, but computes the change over arbitrary time windows.
3 Generated Chart
Based on recent timings, plot generation averages 3 seconds. Please wait while your chart is being generated...
If you notice plotting issues with the image above, please
contact us
and provide the URL address currently shown by your web browser.
IEM Daily Features using this plot
The IEM Daily Features found on this website often utilize plots found on this application. Here is a listing of features referencing this plot type.
- 31 Mar 2026: 53°F Rise
- 20 Jun 2024: Four Degree Difference
- 12 Dec 2022: Little December Movement
- 06 Apr 2021: 53 Degree Warmup
- 24 Jan 2020: Small January Range
- 19 Oct 2018: Big October Warmup
- 05 Apr 2016: Large Rise