Past IEM Features tagged: soilmoisture

Working its way down
05 Jan 2024 05:30 AMLast week, the daily feature presented a time series of soil moisture from a ISU Soil Moisture Network site near Ames. The chart showed the progress of the big Christmas rainfall infiltrating the ground and denoted that the water had yet to reach the sensor at 30 inch depth. Today's featured chart checks in on that progress with another soil moisture sensor near Ames, this one is buried at a deeper depth with its first sensor at 14 inches. It shows a similar story with the rainfall not enough to improve soil moisture at deeper depths, but you can see a very slow moistening happening at 24 inches vs a slow drying at shallower depths as soil water very slowly works its way downward. The response at the next depth of 28 inches is even more muted. It is fascinating to watch the soil moisture with these sensors.
Voting:
Good: 15
Bad: 0
Tags: soilmoisture

Six tenths does not go far
10 May 2021 05:35 AMMuch needed rainfall fell over much of the state on Saturday with some lucky locations receiving upwards of three inches. Some snow was mixed in as well, but we shan't mention such things. Anyway, the featured chart presents soil moisture data from the ISU Soil Moisture station at the ISU Ag Farm west of Ames. The tipping bucket reported just over six tenths of an inch of precipitation which is depicted as an accumulated total by the dashed line. The soil moisture readings at the given depth are shown by the solid lines. The near immediate response at the shallowest depths with soil moisture increasing is obvious with the two inch depth quickly increasing and the four inch depth lagging slightly behind. It is then fascinating to look at the eight inch depth, whose response is muted and lagged by some 6-8 hours. You can see some increase at 12 inches, but the change is very small. Once the rain stopped, you can see how the top layers of soil are already drying back out as moisture seeps deeper.
Voting:
Good: 18
Bad: 1
Tags: soilmoisture

Liquid Gold
22 Jul 2016 05:34 AMThe July rains came just in time for much of central Iowa after a dry June. The featured chart looks at the amount of soil water estimated between the 6 and 30 inch depths by the ISU Soil Moisture station at the ISU Ag Farm west of Ames. The top panel expresses the depth of water in this layer and the bottom shows the day to day change in depth. A few weeks back this plot was featured to show the daily draw down that was occurring without any replenishment. Today's featured chart shows that recharge has happened with much of the daily rainfall (shown by the blue text) infiltrating to this layer.
Voting:
Good: 13
Bad: 0
Tags: soilmoisture

Recharging
16 Oct 2013 05:42 AMOctober 1 is the start of the water year. Since our growing season ends roughly around this time, any precipitation that falls afterwards will go toward recharging soil moisture for the next growing season. The featured chart displays the yearly cycle of root zone soil moisture as estimated by the Iowa Daily Erosion Project. The black line represents the simple average of all the years plotted. Moisture levels start to increase this time of year showing the recharge of soil moisture taking place as there is no longer a crop depleting it. The most substantial recharge takes place during the spring time as rainfall events are more intense and the soil is not frozen.
Voting:
Good: 70
Bad: 7
Tags: idep soilmoisture
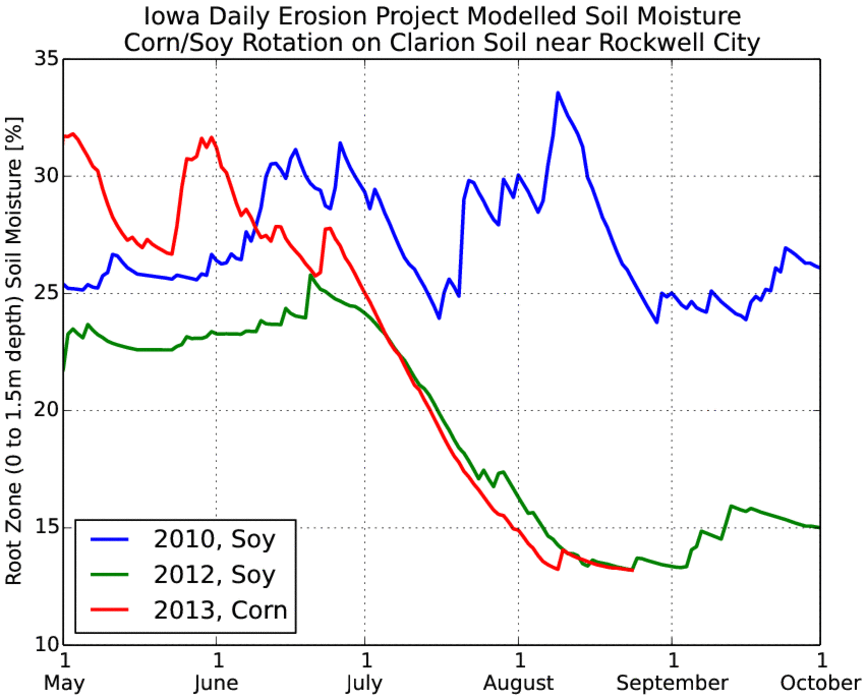
How much soil moisture left?
26 Aug 2013 05:29 AMThe status of this year's corn and soybean crop is about to get very interesting. The featured chart contains model estimates of soil moisture within the top 1.5 meters of soil for a location near Rockwell City. The cool weather of the past few weeks and the lone rain shower earlier in August have bought some time for crops in this area, but the available soil moisture is about gone and the hottest weather of the year has arrived. Plants are not able to access all soil moisture found within their root's reach, so while the chart does not show zero for soil moisture it is practically that for the plant. The Rockwell City area has been one of the driest locations since the first of July with a total of only a half inch or so. Rainfall shows up in the chart as brief upticks in soil moisture. The wet year of 2010 is shown for comparison.
Voting:
Good: 70
Bad: 8
Tags: soilmoisture