Past IEM Features tagged: mslp
Min March Pressure
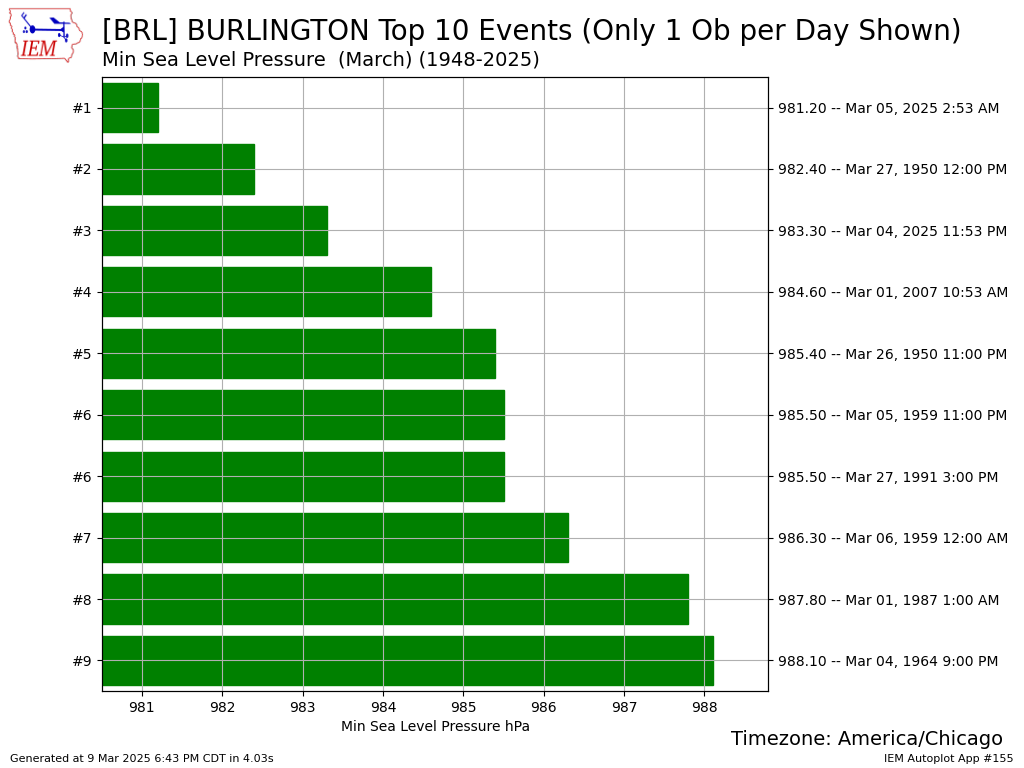
10 Mar 2025 05:30 AMThe storm that brought a blizzard, significant precipitation, and strong winds to Iowa last week also featured a very deep low pressure center that passed over southeastern Iowa. A measure of how strong the low pressure center was can be found by comparing observed sea level pressure readings at an airport to its historical record. The featured chart does just that for Burlington, Iowa and finds that for March, the most recent system had the lowest pressure reading on record for the site. There have been deeper low pressure systems over Iowa during March on a handful of other dates and including some that predated observations from this station. Interestingly, another very strong low pressure system, perhaps with a similarly low pressure reading to the storm last week, is forecast to impact Iowa this coming Friday.
Voting:
Good: 15
Bad: 6
Abstain: 1
Tags: mslp

Pressure Change
17 Apr 2014 05:36 AMAre you old like me and do not enjoy it when the pressure changes as various parts of the body start to ache? The featured map displays the total amount of pressure change for the year to date. This value represents the amount the mean sea level pressure observation has changed hour to hour for the year. The largest values (most change) are in southeastern Colorado / northeastern New Mexico while the lowest values (least change) are along the coast in southern California. The maximum area is the preferred location for low pressure systems to develop thanks to geography and the jet stream. If you are bothered by pressure changes, you may wish to move to Florida or the coast of California!
Voting:
Good: 21
Bad: 6
Abstain: 4
Tags: mslp pressure

Higher and Lower Pressure
05 Dec 2013 05:49 AMLow pressure systems get all the publicity as they are the ones that bring the precipitating weather and are called storm systems. On Wednesday, such a system rapidly deepened over the Midwest before departing to our north early this morning. The featured chart displays the reported mean sea level pressure values from the airport weather stations over the Midwest since Tuesday. It is interesting to notice that while pressure was dropping over some sites, other sites were experiencing an increase in pressure as the high pressure system moved in from our west and strengthened as well. We typically do not think of high pressure systems strengthening at the same time the low pressure system is deepening as well. These changes help to increase pressure gradients, which ultimately drive increased wind speeds.
Voting:
Good: 33
Bad: 5
Abstain: 4
Tags: mslp pressure

Drop in pressure
18 Oct 2012 05:33 AMA strong fall storm system is currently providing Iowa with plenty of wind and severe weather over the southern plains. Our sea level pressure has dropped below 1000 mb for the first time since May. The featured chart looks at some climatological aspects to the mean sea level pressure (MSLP) reading for Des Moines. The top chart presents the range of observations for each day of the year since 1960. The range in pressure is much smaller during the summer time due to the strong storm system tracks being further north and the air mass dominance of warm air. The bottom chart is an attempt at showing the relative frequency of pressure readings and the variability of the fall, winter, and spring months can clearly be seen. These larger differences in pressure help to drive stronger winds as will be the case for today!
Voting:
Good: 26
Bad: 13
Tags: mslp pressure