The following tables present IEM computed monthly data summaries based on
daily data provided by or computed for the IEM. A download interface
exists for the daily summary information. The climatology is provided by the
nearest NCEI climate station (USC00351877) within the current 1991-2020
dataset.
To load shown data into Microsoft Excel,
highlight the table information with your mouse and then copy/paste into Excel.
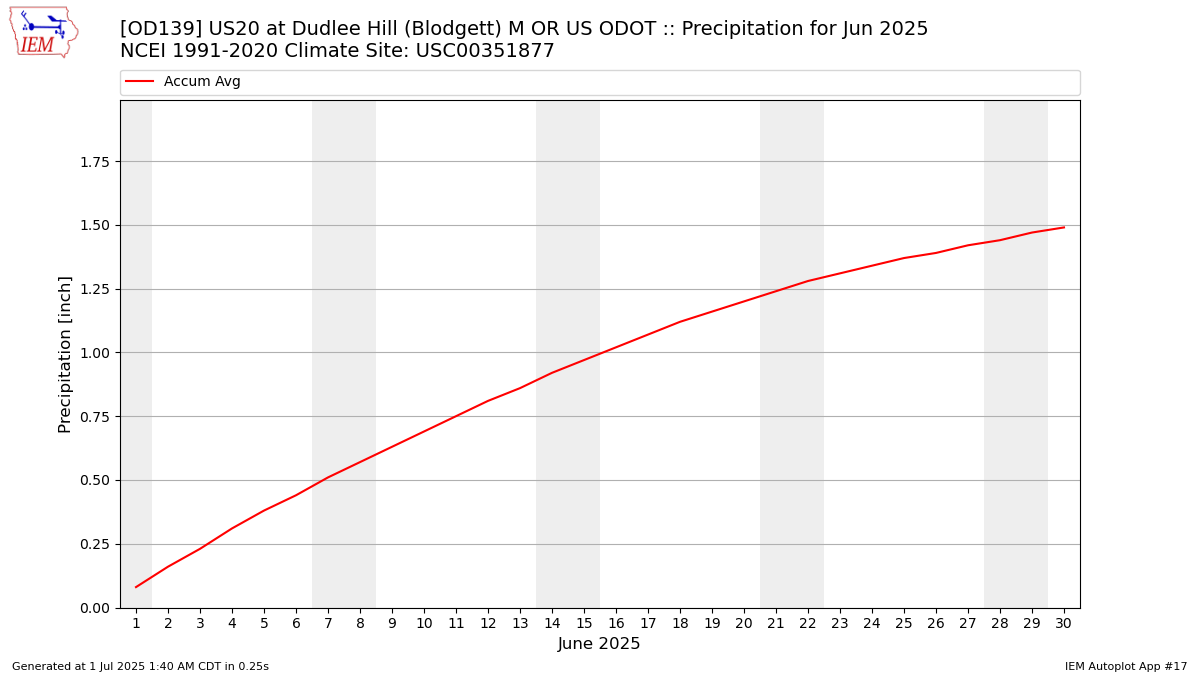
Precipitation Totals [inch]
Year
Jan
Feb
Mar
Apr
May
Jun
Jul
Aug
Sep
Oct
Nov
Dec
2017
M
M
M
M
M
M
M
M
M
M
M
M
2018
M
M
M
M
M
M
M
M
M
M
M
M
2019
M
M
M
M
M
M
M
M
M
M
M
M
2020
M
M
M
M
M
M
M
M
M
M
M
M
2021
M
M
M
M
M
M
M
M
M
M
M
M
2022
M
M
M
M
M
M
M
M
M
M
M
M
2023
M
M
M
M
M
M
M
M
M
M
M
M
2024
M
M
M
M
M
M
M
M
M
M
M
M
2025
M
M
M
M
M
M
M
M
M
M
M
M
NCEI Climatology
11.25
8.67
8.11
5.43
2.80
1.49
0.32
0.42
1.75
4.99
10.39
13.42
Average Wind Speed [MPH]
Year
Jan
Feb
Mar
Apr
May
Jun
Jul
Aug
Sep
Oct
Nov
Dec
2017
M
M
M
M
M
M
M
M
M
M
M
M
2018
M
M
M
M
M
M
M
M
M
M
M
M
2019
M
M
M
M
M
M
M
M
M
M
M
M
2020
M
M
M
M
M
M
M
M
M
M
M
M
2021
M
M
M
M
M
M
M
M
M
M
M
M
2022
M
M
M
M
M
M
M
M
M
M
M
M
2023
M
M
M
M
M
M
M
M
M
M
M
M
2024
M
M
M
M
M
M
M
M
M
M
M
M
2025
M
0.7
0.8
1.2
1.1
1.2
M
M
M
M
M
M
NCEI Climatology
M
M
M
M
M
M
M
M
M
M
M
M
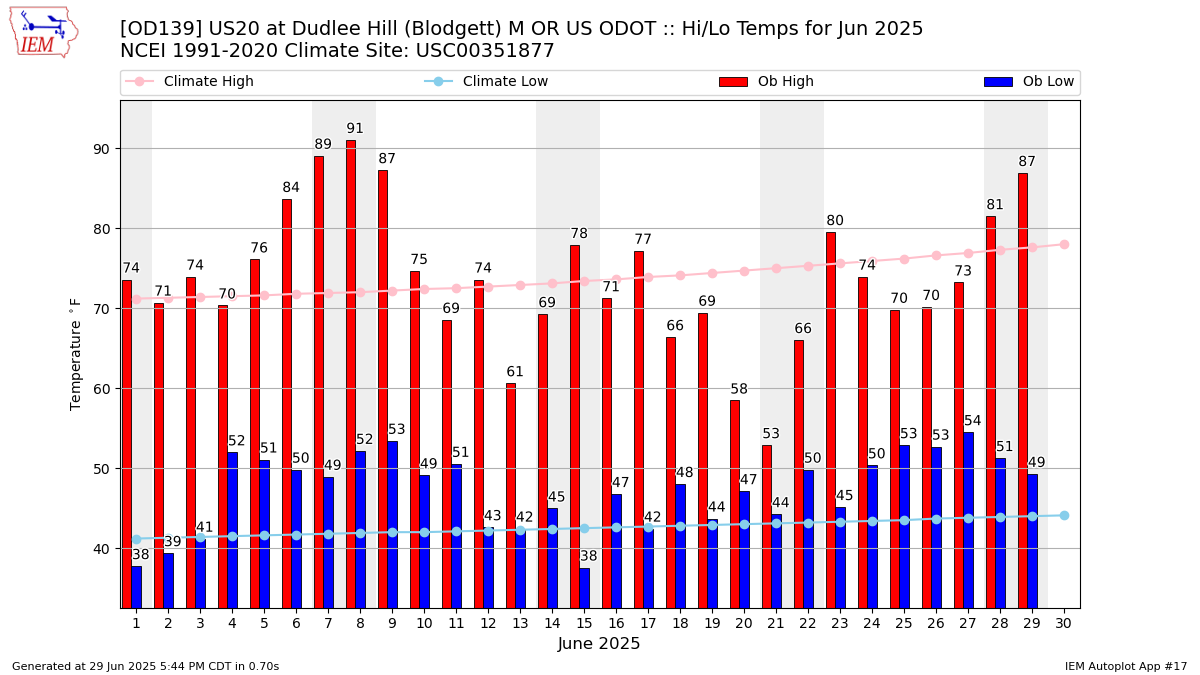
Average Daily High Temperature [F]
Year
Jan
Feb
Mar
Apr
May
Jun
Jul
Aug
Sep
Oct
Nov
Dec
2017
M
M
M
M
M
M
M
M
M
M
49.18
43.49
2018
47.37
46.01
50.82
57.74
67.08
71.32
80.58
77.69
71.78
63.91
51.40
43.81
2019
45.74
40.16
53.32
58.50
67.05
73.20
74.83
78.10
68.44
57.33
50.46
45.29
2020
46.10
46.86
52.31
61.32
64.85
68.82
77.66
75.73
74.46
61.98
49.05
43.56
2021
46.39
45.29
50.18
63.86
66.08
75.11
80.56
76.15
70.80
57.47
51.52
41.67
2022
45.88
48.13
54.24
53.29
59.80
68.97
79.59
80.83
75.01
65.19
45.76
41.46
2023
43.80
44.27
45.70
54.40
69.53
73.54
80.42
80.74
71.36
60.01
48.73
47.83
2024
44.15
47.85
51.85
56.23
64.71
71.06
82.12
76.72
72.18
61.68
48.34
45.08
2025
44.35
45.25
53.62
62.52
66.48
73.19
M
M
M
M
M
M
NCEI Climatology
47.10
51.21
56.21
61.39
68.91
73.90
82.39
83.00
77.40
65.00
52.71
46.09
Average Daily Low Temperature [F]
Year
Jan
Feb
Mar
Apr
May
Jun
Jul
Aug
Sep
Oct
Nov
Dec
2017
M
M
M
M
M
M
M
M
M
M
38.68
31.47
2018
36.87
33.53
33.80
39.03
45.05
46.92
51.16
52.56
45.29
41.52
38.18
33.37
2019
34.56
30.80
32.83
41.68
45.51
47.92
52.58
52.12
50.41
37.08
35.30
34.14
2020
32.26
30.99
30.50
32.27
33.65
35.90
33.89
33.96
33.94
32.77
31.83
32.03
2021
31.91
31.64
30.82
31.83
33.05
33.78
34.03
34.01
33.48
32.90
32.52
32.03
2022
30.55
30.12
31.78
31.83
39.98
48.61
53.31
54.00
50.38
45.29
32.31
32.51
2023
34.78
30.32
32.33
37.61
45.87
46.70
51.70
54.29
48.71
44.40
37.43
39.04
2024
35.59
36.19
35.89
38.45
42.04
46.67
52.18
51.72
50.12
41.91
37.65
36.04
2025
31.87
32.29
37.45
38.40
42.13
47.21
M
M
M
M
M
M
NCEI Climatology
27.81
28.33
30.51
33.00
38.60
42.60
45.70
45.69
42.30
36.30
30.70
28.30
Average Daily Temperature (high+low)/2 [F]
Year
Jan
Feb
Mar
Apr
May
Jun
Jul
Aug
Sep
Oct
Nov
Dec
2017
M
M
M
M
M
M
M
M
M
M
43.93
37.48
2018
42.12
39.77
42.31
48.38
56.07
59.12
65.87
65.13
58.54
52.71
44.79
38.59
2019
40.15
35.48
43.07
50.09
56.28
60.56
63.71
65.11
59.43
47.20
42.88
39.71
2020
39.18
38.93
41.41
46.79
49.25
52.36
55.77
54.85
54.20
47.37
40.44
37.80
2021
39.15
38.46
40.50
47.85
49.56
54.45
57.30
55.08
52.14
45.18
42.02
36.85
2022
38.22
39.12
43.01
42.56
49.89
58.79
66.45
67.42
62.69
55.24
39.04
36.99
2023
39.29
37.29
39.01
46.00
57.70
60.12
66.06
67.52
60.03
52.21
43.08
43.44
2024
39.87
42.02
43.87
47.34
53.37
58.86
67.15
64.22
61.15
51.79
43.00
40.56
2025
38.11
38.77
45.53
50.46
54.31
60.20
M
M
M
M
M
M
NCEI Climatology
37.45
39.77
43.36
47.20
53.76
58.25
64.05
64.34
59.85
50.65
41.70
37.20
Average Relative Humidity [%]
This value is computed via a simple average of available observations weighted
by the duration between observations.