| May 2025 | Jun 2025 | Jul 2025 | ||||
|---|---|---|---|---|---|---|
| Sunday | Monday | Tuesday | Wednesday | Thursday | Friday | Saturday |
| 01 High: 74.64018 Low: 32.599403 Precip: M Avg Wind: SW @ 1.2 RH% Min/Max: 26-97 Feel Min/Max: 33 to 75 | 02 High: 84.68059 Low: 46.549404 Precip: M Avg Wind: SSW @ 3.9 RH% Min/Max: 38-95 Feel Min/Max: 47 to 84 | 03 High: 68.140396 Low: 50.410385 Precip: M Avg Wind: NNW @ 1.2 RH% Min/Max: 76-97 Feel Min/Max: 50 to 68 | 04 High: 74.159584 Low: 48.38 Precip: M Avg Wind: WNW @ 1.0 RH% Min/Max: 27-100 Feel Min/Max: 48 to 74 | 05 High: 76.949615 Low: 40.209797 Precip: M Avg Wind: SSW @ 1.2 RH% Min/Max: 25-97 Feel Min/Max: 40 to 77 | 06 High: 69.659584 Low: 51.729786 Precip: M Avg Wind: NNE @ 0.3 RH% Min/Max: 46-90 Feel Min/Max: 52 to 70 | 07 High: 73.880585 Low: 53.4308 Precip: M Avg Wind: SSW @ 3.0 RH% Min/Max: 38-91 Feel Min/Max: 53 to 74 |
| 08 High: 68.03059 Low: 51.659584 Precip: M Avg Wind: SW @ 3.4 RH% Min/Max: 44-95 Feel Min/Max: 52 to 68 | 09 High: 61.410225 Low: 49.209797 Precip: M Avg Wind: NW @ 2.1 RH% Min/Max: 70-96 Feel Min/Max: 48 to 61 | 10 High: 66.70937 Low: 49.929787 Precip: M Avg Wind: W @ 1.6 RH% Min/Max: 64-95 Feel Min/Max: 50 to 67 | 11 High: 71.90057 Low: 45.23 Precip: M Avg Wind: NNW @ 1.4 RH% Min/Max: 41-99 Feel Min/Max: 45 to 72 | 12 High: 71.690025 Low: 42.9494 Precip: M Avg Wind: ENE @ 0.1 RH% Min/Max: 41-98 Feel Min/Max: 43 to 72 | 13 High: 55.18938 Low: 46.9292 Precip: M Avg Wind: ENE @ 0.1 RH% Min/Max: 75-97 Feel Min/Max: 47 to 55 | 14 High: 57.189224 Low: 48.939808 Precip: M Avg Wind: NNE @ 0.1 RH% Min/Max: 87-99 Feel Min/Max: 48 to 57 |
| 15 High: 65.49978 Low: 53.760223 Precip: M Avg Wind: S @ 0.1 RH% Min/Max: 76-97 Feel Min/Max: 54 to 65 | 16 High: 79.41918 Low: 57.54919 Precip: M Avg Wind: SSW @ 2.5 RH% Min/Max: 63-98 Feel Min/Max: 58 to 79 | 17 High: 78.1502 Low: 58.130585 Precip: M Avg Wind: W @ 2.2 RH% Min/Max: 48-93 Feel Min/Max: 58 to 78 | 18 High: 80.94018 Low: 51.220406 Precip: M Avg Wind: NNW @ 0.6 RH% Min/Max: 37-98 Feel Min/Max: 51 to 80 | 19 High: 78.9098 Low: 50.360012 Precip: M Avg Wind: WSW @ 0.8 RH% Min/Max: 46-97 Feel Min/Max: 50 to 79 | 20 High: 82.4396 Low: 57.570778 Precip: M Avg Wind: SSW @ 2.6 RH% Min/Max: 51-95 Feel Min/Max: 58 to 84 | 21 High: 87.36982 Low: 63.820404 Precip: M Avg Wind: SSW @ 3.6 RH% Min/Max: 67-96 Feel Min/Max: 64 to 97 |
| 22 High: 90.62963 Low: 77.39061 Precip: M Avg Wind: SSW @ 6.8 RH% Min/Max: 58-82 Feel Min/Max: 77 to 101 | 23 High: 83.84002 Low: 62.580215 Precip: M Avg Wind: SW @ 4.6 RH% Min/Max: 56-94 Feel Min/Max: 63 to 89 | 24 High: 79.48938 Low: 54.420776 Precip: M Avg Wind: N @ 0.4 RH% Min/Max: 35-96 Feel Min/Max: 54 to 79 | 25 High: 69.5606 Low: 52.66939 Precip: M Avg Wind: E @ 0.2 RH% Min/Max: 79-97 Feel Min/Max: 53 to 70 | 26 High: 60.74962 Low: 54.3002 Precip: M Avg Wind: E @ 0.2 RH% Min/Max: 92-98 Feel Min/Max: 54 to 61 | 27 High: 63.84919 Low: 55.77078 Precip: M Avg Wind: NNW @ 1.5 RH% Min/Max: 78-99 Feel Min/Max: 56 to 64 | 28 High: 56.19919 Low: 51.830585 Precip: M RH% Min/Max: 96-99 Feel Min/Max: 52 to 56 |
| 29 Precip: M | 30 | 01 | 02 | 03 | 04 | 05 |
The data presented here provided by IEM API webservice: daily.json. A simple CSV option exists as well.
Daily High/Low Plot
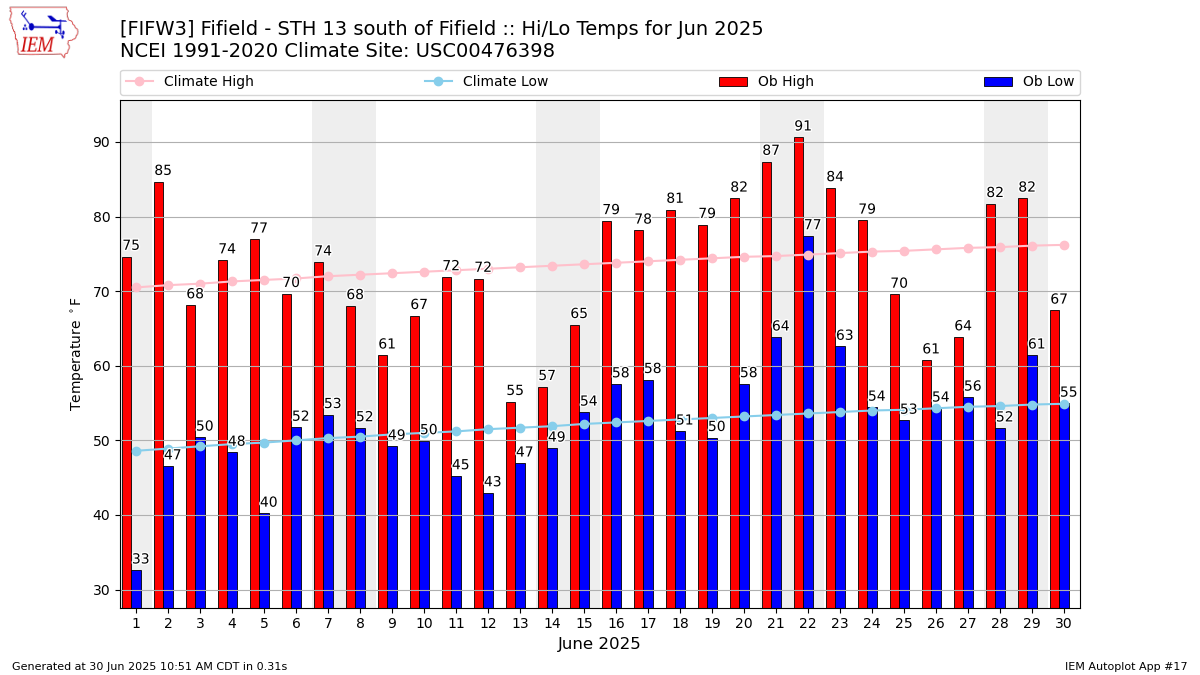
Description: This chart of the monthly temperature data. The bars are the observations and the dots are climatology.
Daily Rainfall
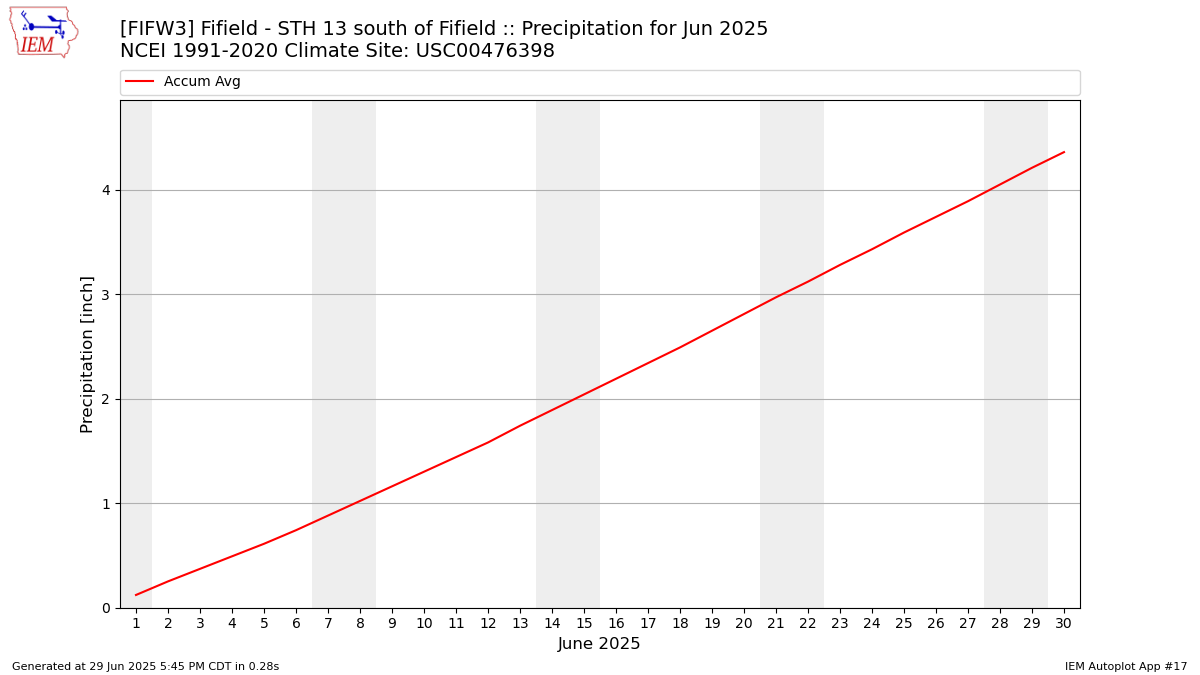
Description: This chart is of daily precipitation for the month. The red line would be an average month while the blue line and bars are observations.
Daily Average Wind Speeds
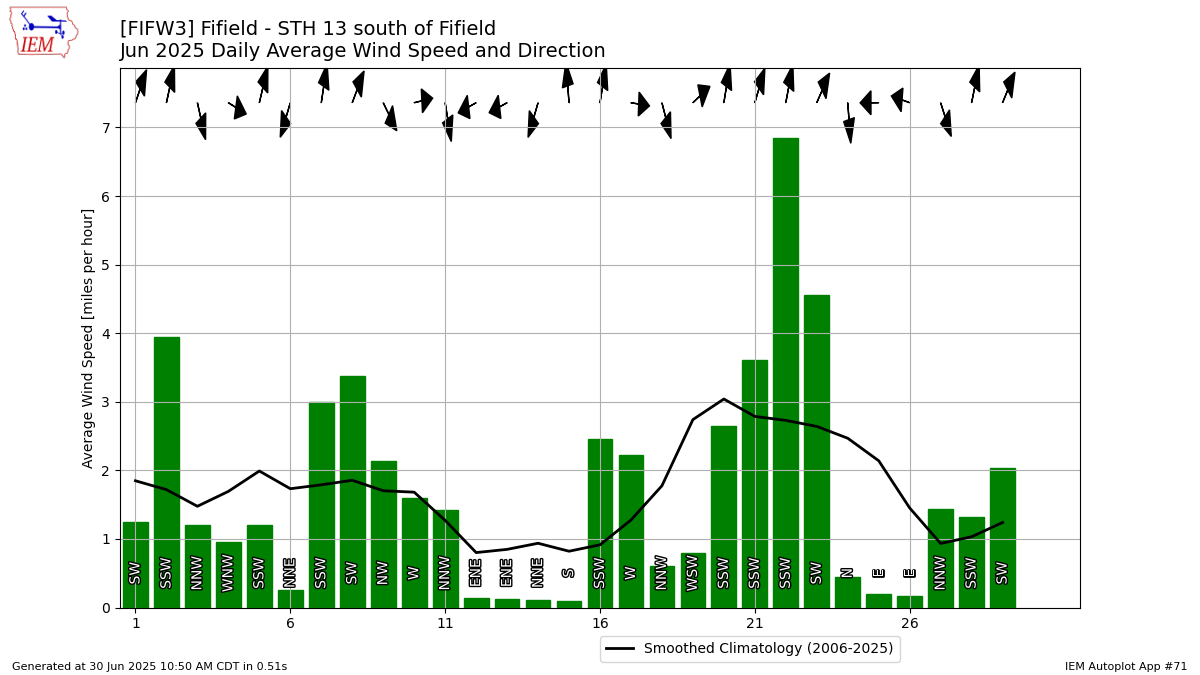
Description: This chart is of the daily average wind speeds.
The data presented here provided by IEM API webservice: daily.json. A simple CSV option exists as well.