| May 2025 | Jun 2025 | Jul 2025 | ||||
|---|---|---|---|---|---|---|
| Sunday | Monday | Tuesday | Wednesday | Thursday | Friday | Saturday |
| 01 High: 71.529785 Low: 46.070618 Precip: M Avg Wind: N @ 0.0 | 02 High: 82.41081 Low: 51.02062 Precip: M Avg Wind: N @ 0.0 | 03 High: 82.0598 Low: 65.60958 Precip: M Avg Wind: N @ 0.0 | 04 High: 69.92963 Low: 57.860596 Precip: M Avg Wind: N @ 0.0 | 05 High: 74.960594 Low: 54.629627 Precip: M Avg Wind: N @ 0.0 | 06 High: 75.979416 Low: 57.500576 Precip: M Avg Wind: N @ 0.0 | 07 High: 76.49061 Low: 56.10921 Precip: M Avg Wind: N @ 0.0 |
| 08 High: 73.86081 Low: 53.97078 Precip: M Avg Wind: N @ 0.0 | 09 High: 64.49002 Low: 52.7792 Precip: M Avg Wind: N @ 0.0 | 10 High: 75.09018 Low: 52.140182 Precip: M Avg Wind: N @ 0.0 | 11 High: 87.6704 Low: 59.590393 Precip: M Avg Wind: N @ 0.0 | 12 High: 77.300575 Low: 60.02062 Precip: M Avg Wind: N @ 0.0 | 13 High: 73.619606 Low: 56.3792 Precip: M Avg Wind: N @ 0.0 | 14 High: 76.28 Low: 55.720406 Precip: M Avg Wind: N @ 0.0 |
| 15 High: 81.01038 Low: 56.460224 Precip: M Avg Wind: N @ 0.0 | 16 High: 84.23959 Low: 59.88922 Precip: M Avg Wind: N @ 0.0 | 17 High: 84.11001 Low: 67.53922 Precip: M | 18 Precip: M | 19 | 20 | 21 |
| 22 | 23 | 24 | 25 | 26 | 27 | 28 |
| 29 | 30 | 01 | 02 | 03 | 04 | 05 |
The data presented here provided by IEM API webservice: daily.json. A simple CSV option exists as well.
Daily High/Low Plot
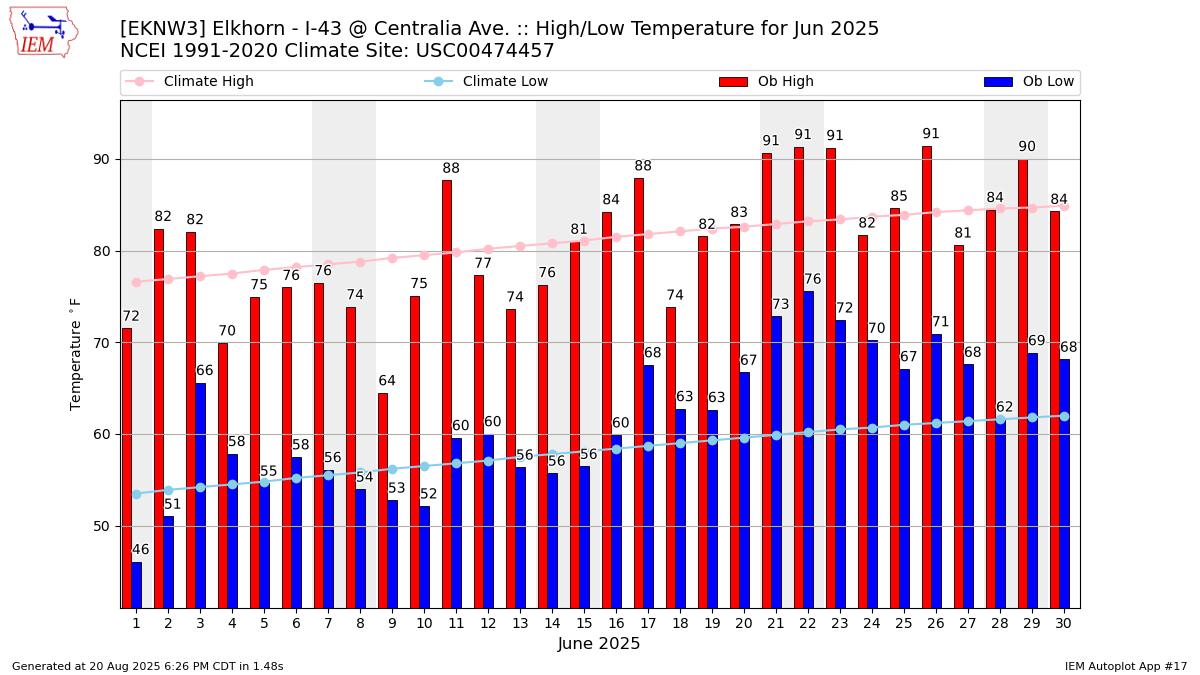
Description: This chart of the monthly temperature data. The bars are the observations and the dots are climatology.
Daily Rainfall
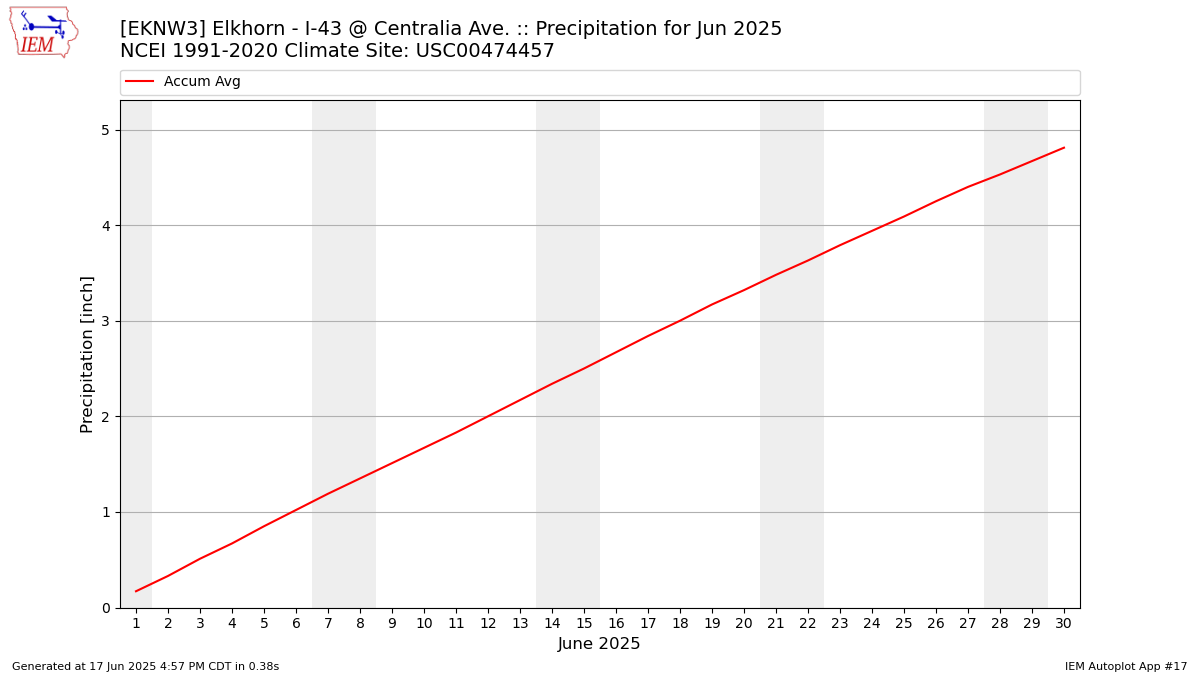
Description: This chart is of daily precipitation for the month. The red line would be an average month while the blue line and bars are observations.
Daily Average Wind Speeds
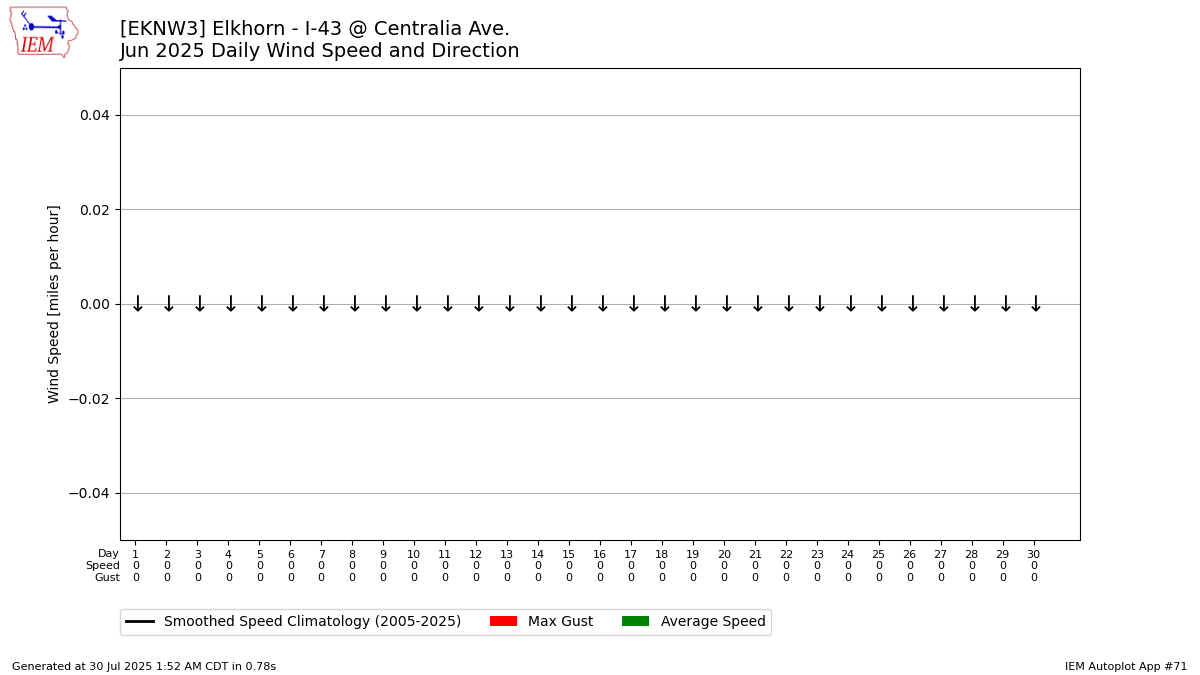
Description: This chart is of the daily average wind speeds.
The data presented here provided by IEM API webservice: daily.json. A simple CSV option exists as well.