| May 2025 | Jun 2025 | Jul 2025 | ||||
|---|---|---|---|---|---|---|
| Sunday | Monday | Tuesday | Wednesday | Thursday | Friday | Saturday |
| 01 High: 77.48058 Low: 41.88922 Precip: M Avg Wind: S @ 1.3 RH% Min/Max: 28-90 Feel Min/Max: 42 to 77 | 02 High: 87.99978 Low: 54.590023 Precip: M Avg Wind: S @ 4.1 RH% Min/Max: 34-92 Feel Min/Max: 55 to 87 | 03 High: 71.7098 Low: 55.880585 Precip: M Avg Wind: WSW @ 2.1 RH% Min/Max: 76-98 Feel Min/Max: 56 to 72 | 04 High: 76.47979 Low: 48.99919 Precip: M Avg Wind: W @ 0.7 RH% Min/Max: 22-99 Feel Min/Max: 49 to 76 | 05 High: 78.24018 Low: 47.569977 Precip: M Avg Wind: SSE @ 0.5 RH% Min/Max: 27-95 Feel Min/Max: 48 to 78 | 06 High: 72.75921 Low: 61.039383 Precip: M Avg Wind: SSW @ 0.9 RH% Min/Max: 52-83 Feel Min/Max: 61 to 73 | 07 High: 73.189384 Low: 56.679787 Precip: M Avg Wind: SE @ 1.5 RH% Min/Max: 50-95 Feel Min/Max: 57 to 72 |
| 08 High: 72.829414 Low: 56.01918 Precip: M Avg Wind: WSW @ 5.2 RH% Min/Max: 35-96 Feel Min/Max: 56 to 72 | 09 High: 64.610596 Low: 49.859585 Precip: M Avg Wind: W @ 5.5 RH% Min/Max: 58-96 Feel Min/Max: 47 to 65 | 10 High: 75.25942 Low: 56.679787 Precip: M Avg Wind: WSW @ 3.1 RH% Min/Max: 48-85 Feel Min/Max: 57 to 75 | 11 High: 75.56001 Low: 56.04082 Precip: M Avg Wind: W @ 1.0 RH% Min/Max: 44-92 Feel Min/Max: 56 to 75 | 12 High: 70.359795 Low: 51.8792 Precip: M Avg Wind: E @ 2.1 RH% Min/Max: 56-97 Feel Min/Max: 52 to 70 | 13 High: 56.170406 Low: 50.399616 Precip: M Avg Wind: ENE @ 3.3 RH% Min/Max: 85-98 Feel Min/Max: 50 to 56 | 14 High: 58.56982 Low: 52.48938 Precip: M Avg Wind: E @ 0.9 RH% Min/Max: 90-98 Feel Min/Max: 53 to 59 |
| 15 High: 68.84962 Low: 56.04082 Precip: M Avg Wind: ENE @ 0.4 RH% Min/Max: 83-96 Feel Min/Max: 56 to 69 | 16 High: 79.41918 Low: 62.49018 Precip: M Avg Wind: SSE @ 2.8 RH% Min/Max: 68-98 Feel Min/Max: 62 to 79 | 17 High: 71.20042 Low: 64.58 Precip: M RH% Min/Max: 83-91 Feel Min/Max: 65 to 71 | 18 Precip: M | 19 | 20 | 21 |
| 22 | 23 | 24 | 25 | 26 | 27 | 28 |
| 29 | 30 | 01 | 02 | 03 | 04 | 05 |
The data presented here provided by IEM API webservice: daily.json. A simple CSV option exists as well.
Daily High/Low Plot
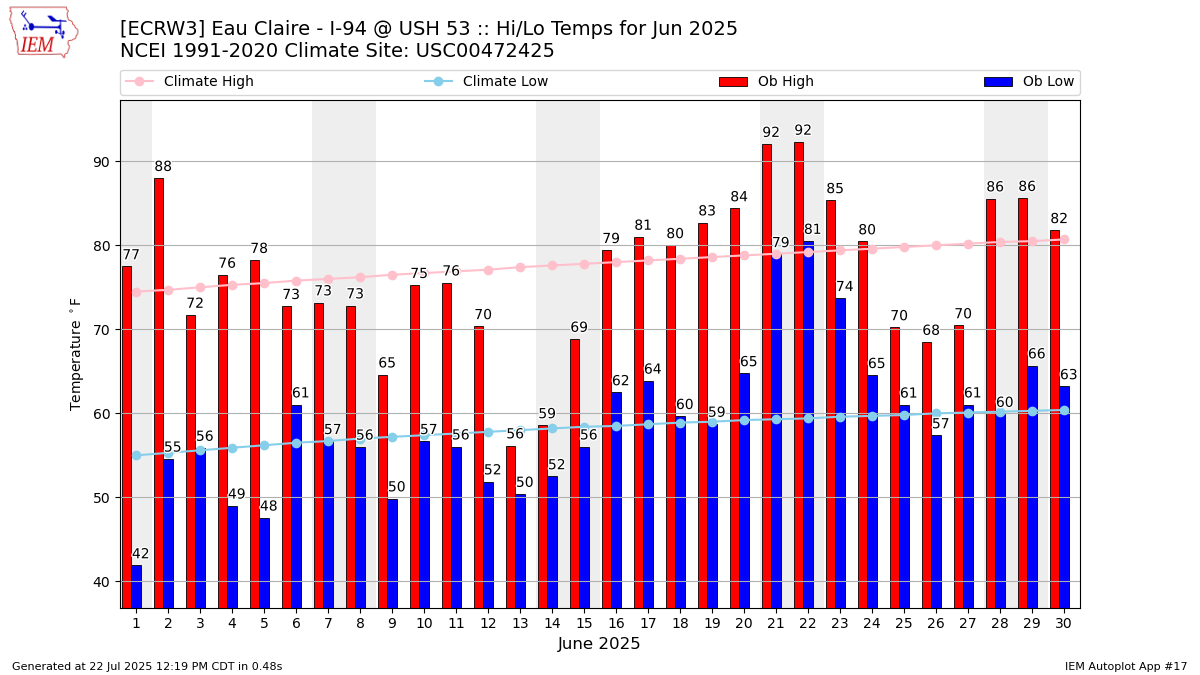
Description: This chart of the monthly temperature data. The bars are the observations and the dots are climatology.
Daily Rainfall
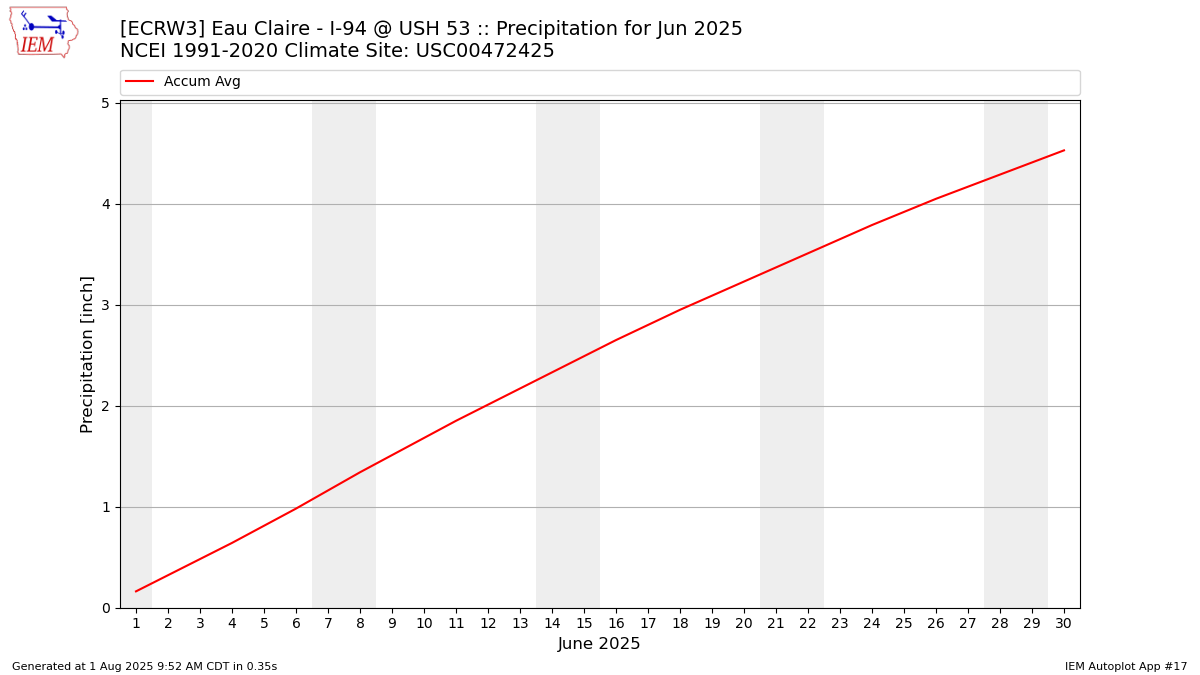
Description: This chart is of daily precipitation for the month. The red line would be an average month while the blue line and bars are observations.
Daily Average Wind Speeds
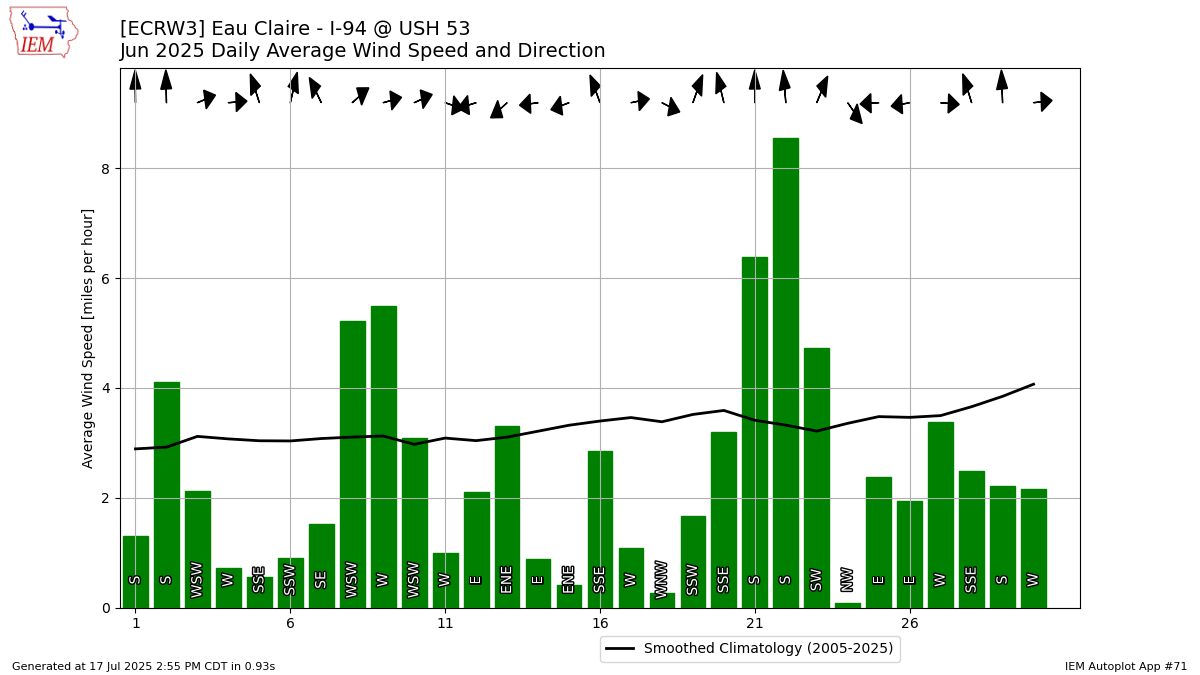
Description: This chart is of the daily average wind speeds.
The data presented here provided by IEM API webservice: daily.json. A simple CSV option exists as well.