| May 2025 | Jun 2025 | Jul 2025 | ||||
|---|---|---|---|---|---|---|
| Sunday | Monday | Tuesday | Wednesday | Thursday | Friday | Saturday |
| 01 High: 78.96918 Low: 52.829628 Precip: M Avg Wind: N @ 0.0 RH% Min/Max: 27-56 Feel Min/Max: 53 to 79 | 02 High: 88.23922 Low: 60.9494 Precip: M Avg Wind: N @ 0.0 RH% Min/Max: 35-85 Feel Min/Max: 61 to 88 | 03 High: 72.3002 Low: 54.460384 Precip: M Avg Wind: N @ 0.0 RH% Min/Max: 72-99 Feel Min/Max: 54 to 72 | 04 High: 77.790184 Low: 53.549618 Precip: M Avg Wind: N @ 0.0 RH% Min/Max: 29-95 Feel Min/Max: 54 to 78 | 05 High: 81.750206 Low: 60.36982 Precip: M Avg Wind: N @ 0.0 RH% Min/Max: 28-62 Feel Min/Max: 60 to 80 | 06 High: 74.49082 Low: 57.610382 Precip: M Avg Wind: N @ 0.0 RH% Min/Max: 52-92 Feel Min/Max: 58 to 74 | 07 High: 66.000206 Low: 58.819977 Precip: M Avg Wind: N @ 0.0 RH% Min/Max: 66-92 Feel Min/Max: 59 to 66 |
| 08 High: 73.92019 Low: 57.590607 Precip: M Avg Wind: N @ 0.0 RH% Min/Max: 31-94 Feel Min/Max: 58 to 74 | 09 High: 65.19018 Low: 48.009212 Precip: M Avg Wind: N @ 0.0 RH% Min/Max: 56-96 Feel Min/Max: 48 to 65 | 10 High: 78.76038 Low: 56.08037 Precip: M Avg Wind: N @ 0.0 RH% Min/Max: 42-82 Feel Min/Max: 56 to 79 | 11 High: 79.5308 Low: 64.189384 Precip: M Avg Wind: N @ 0.0 RH% Min/Max: 41-71 Feel Min/Max: 64 to 80 | 12 High: 68.91982 Low: 56.789597 Precip: M Avg Wind: N @ 0.0 RH% Min/Max: 59-93 Feel Min/Max: 57 to 69 | 13 High: 59.0792 Low: 52.570404 Precip: M Avg Wind: N @ 0.0 RH% Min/Max: 69-91 Feel Min/Max: 53 to 59 | 14 High: 71.279625 Low: 51.45079 Precip: M Avg Wind: N @ 0.0 RH% Min/Max: 73-96 Feel Min/Max: 51 to 71 |
| 15 High: 74.35943 Low: 56.600574 Precip: M Avg Wind: N @ 0.0 RH% Min/Max: 75-96 Feel Min/Max: 57 to 74 | 16 High: 81.03922 Low: 64.880585 Precip: M Avg Wind: N @ 0.0 RH% Min/Max: 67-97 Feel Min/Max: 65 to 84 | 17 High: 82.880585 Low: 65.46918 Precip: M Avg Wind: N @ 0.0 RH% Min/Max: 49-95 Feel Min/Max: 65 to 84 | 18 High: 79.43 Low: 65.98043 Precip: M Avg Wind: N @ 0.0 RH% Min/Max: 50-89 Feel Min/Max: 66 to 79 | 19 High: 86.01982 Low: 63.730427 Precip: M Avg Wind: N @ 0.0 RH% Min/Max: 41-81 Feel Min/Max: 64 to 86 | 20 High: 74.31982 Low: 72.699776 Precip: M RH% Min/Max: 65-69 Feel Min/Max: 73 to 74 | 21 Precip: M |
| 22 | 23 | 24 | 25 | 26 | 27 | 28 |
| 29 | 30 | 01 | 02 | 03 | 04 | 05 |
The data presented here provided by IEM API webservice: daily.json. A simple CSV option exists as well.
Daily High/Low Plot
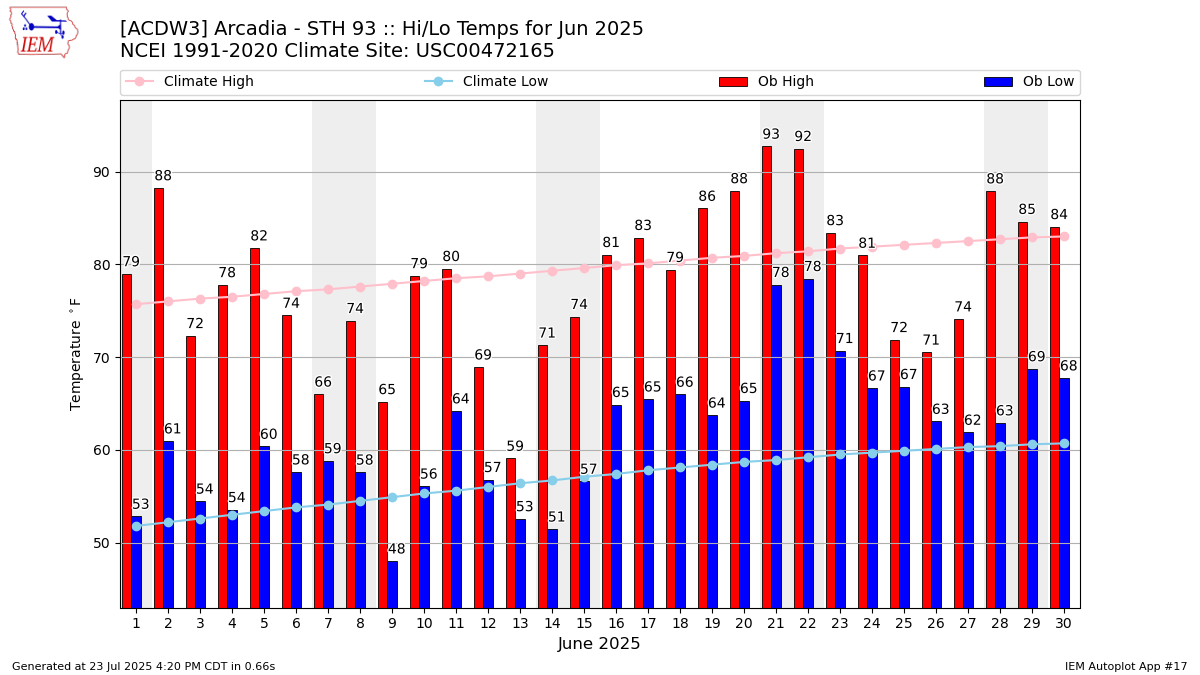
Description: This chart of the monthly temperature data. The bars are the observations and the dots are climatology.
Daily Rainfall
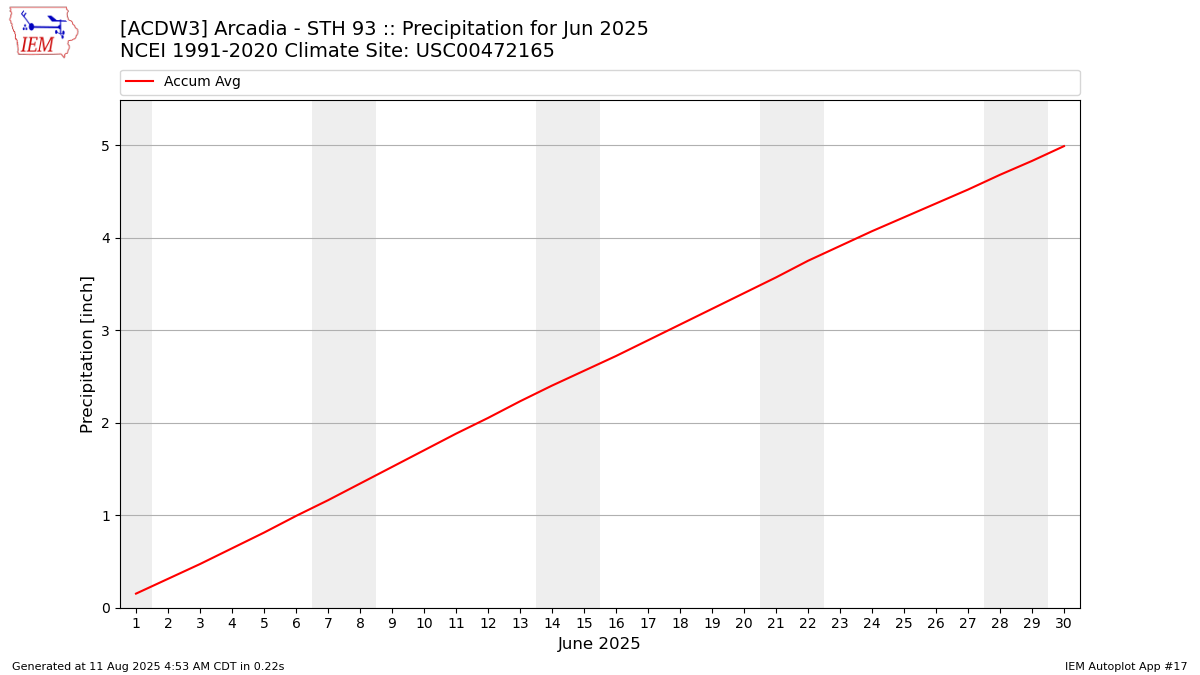
Description: This chart is of daily precipitation for the month. The red line would be an average month while the blue line and bars are observations.
Daily Average Wind Speeds
Description: This chart is of the daily average wind speeds.
The data presented here provided by IEM API webservice: daily.json. A simple CSV option exists as well.