| May 2025 | Jun 2025 | Jul 2025 | ||||
|---|---|---|---|---|---|---|
| Sunday | Monday | Tuesday | Wednesday | Thursday | Friday | Saturday |
| 01 High: 77.88021 Low: 52.37062 Precip: M Avg Wind: NE @ 3.1 Gust: 16 (2:00 PM) RH% Min/Max: 15-45 Feel Min/Max: 52 to 78 | 02 High: 64.799614 Low: 43.66939 Precip: M Avg Wind: WSW @ 3.3 Gust: 19 (2:40 PM) RH% Min/Max: 17-69 Feel Min/Max: 42 to 65 | 03 High: 58.409584 Low: 35.650417 Precip: M Avg Wind: SW @ 3.2 Gust: 21 (5:50 PM) RH% Min/Max: 22-59 Feel Min/Max: 36 to 58 | 04 High: 61.239223 Low: 38.469177 Precip: M Avg Wind: WSW @ 3.2 Gust: 17 (3:00 PM) RH% Min/Max: 30-62 Feel Min/Max: 35 to 61 | 05 High: 62.670193 Low: 41.379787 Precip: M Avg Wind: W @ 2.6 Gust: 15 (12:20 PM) RH% Min/Max: 25-55 Feel Min/Max: 41 to 63 | 06 High: 64.9292 Low: 43.3598 Precip: M Avg Wind: SSW @ 2.9 Gust: 24 (2:50 PM) RH% Min/Max: 23-65 Feel Min/Max: 42 to 65 | 07 High: 69.659584 Low: 46.200203 Precip: M Avg Wind: E @ 3.5 Gust: 18 (5:10 PM) RH% Min/Max: 21-63 Feel Min/Max: 44 to 70 |
| 08 High: 73.14082 Low: 50.030586 Precip: M Avg Wind: ENE @ 3.2 Gust: 17 (5:00 PM) RH% Min/Max: 21-54 Feel Min/Max: 50 to 73 | 09 High: 75.000206 Low: 49.44018 Precip: M Avg Wind: W @ 3.1 Gust: 18 (2:20 PM) RH% Min/Max: 20-58 Feel Min/Max: 48 to 75 | 10 High: 75.56001 Low: 52.399403 Precip: M Avg Wind: NNE @ 3.2 Gust: 17 (4:10 PM) RH% Min/Max: 22-50 Feel Min/Max: 52 to 76 | 11 High: 77.95042 Low: 54.719604 Precip: M Avg Wind: WSW @ 3.4 Gust: 25 (3:10 PM) RH% Min/Max: 15-67 Feel Min/Max: 55 to 78 | 12 High: 76.38981 Low: 53.560383 Precip: M Avg Wind: N @ 3.0 Gust: 24 (12:20 PM) RH% Min/Max: 13-56 Feel Min/Max: 54 to 76 | 13 High: 76.3196 Low: 50.480587 Precip: M Avg Wind: WNW @ 3.3 Gust: 19 (10:20 AM) RH% Min/Max: 10-56 Feel Min/Max: 50 to 76 | 14 High: 77.199776 Low: 51.999775 Precip: M Avg Wind: NW @ 3.0 Gust: 25 (1:30 AM) RH% Min/Max: 9-44 Feel Min/Max: 52 to 77 |
| 15 High: 79.50921 Low: 50.2808 Precip: M Avg Wind: WNW @ 3.1 Gust: 24 (9:00 AM) RH% Min/Max: 9-54 Feel Min/Max: 50 to 80 | 16 High: 75.21081 Low: 54.010384 Precip: M Avg Wind: NE @ 2.9 Gust: 16 (4:10 PM) RH% Min/Max: 12-50 Feel Min/Max: 54 to 75 | 17 High: 66.50063 Low: 49.580585 Precip: M Gust: 16 (11:30 AM) RH% Min/Max: 24-56 Feel Min/Max: 49 to 67 | 18 Precip: M | 19 | 20 | 21 |
| 22 | 23 | 24 | 25 | 26 | 27 | 28 |
| 29 | 30 | 01 | 02 | 03 | 04 | 05 |
The data presented here provided by IEM API webservice: daily.json. A simple CSV option exists as well.
Daily High/Low Plot
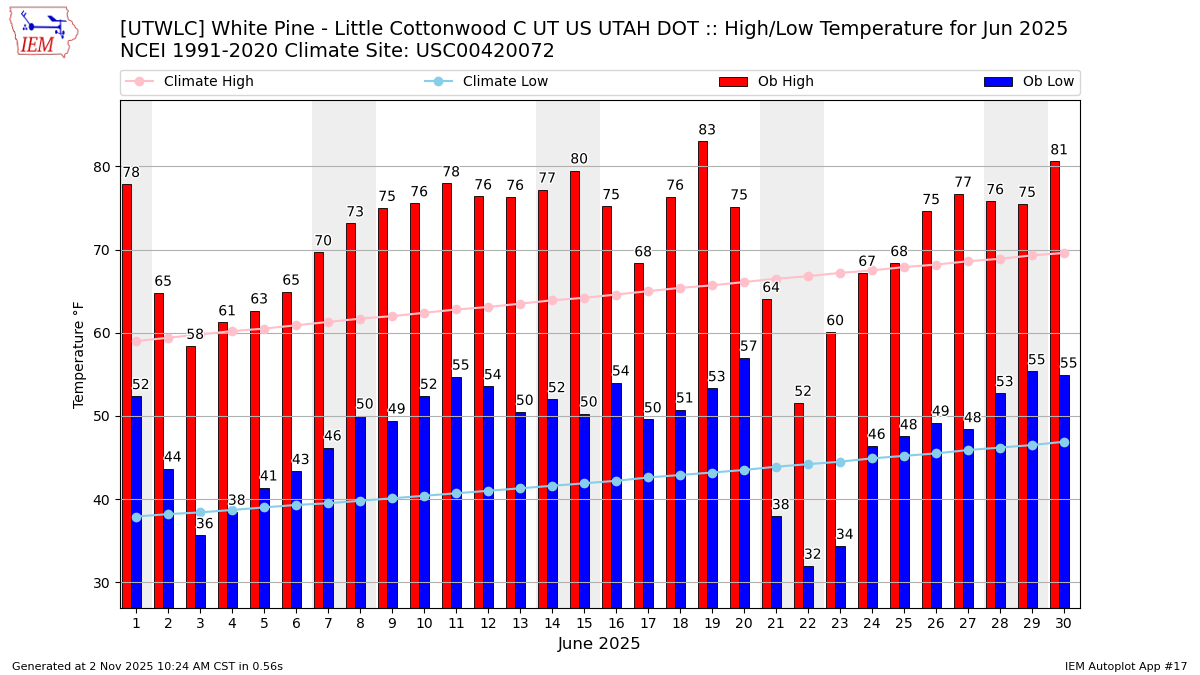
Description: This chart of the monthly temperature data. The bars are the observations and the dots are climatology.
Daily Rainfall
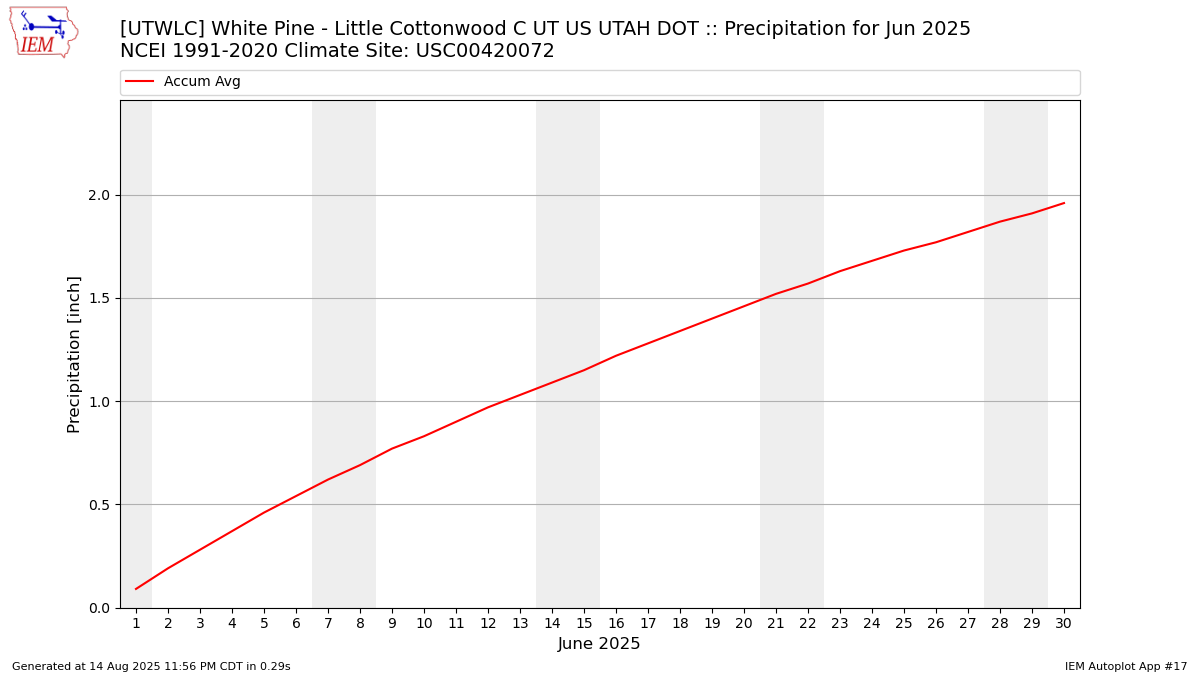
Description: This chart is of daily precipitation for the month. The red line would be an average month while the blue line and bars are observations.
Daily Average Wind Speeds
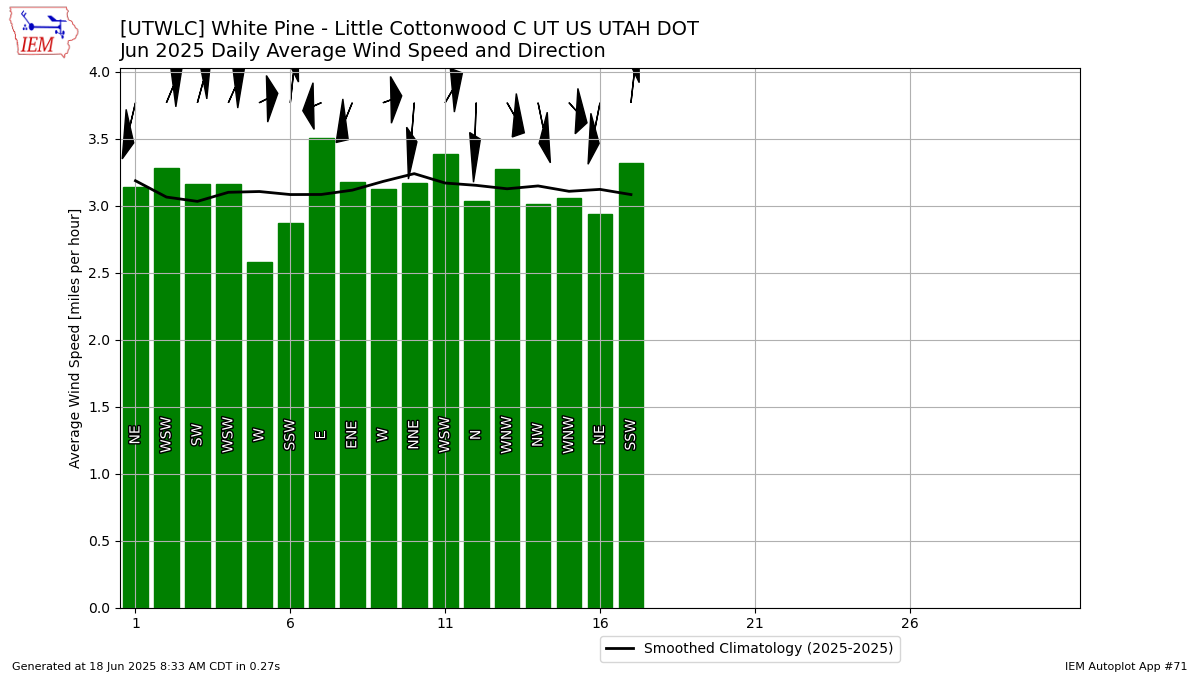
Description: This chart is of the daily average wind speeds.
The data presented here provided by IEM API webservice: daily.json. A simple CSV option exists as well.