| Jul 2025 | Aug 2025 | Sep 2025 | ||||
|---|---|---|---|---|---|---|
| Sunday | Monday | Tuesday | Wednesday | Thursday | Friday | Saturday |
| 27 | 28 | 29 | 30 | 31 | 01 High: 96.000786 Low: 66.66081 Precip: M Avg Wind: SE @ 4.4 Gust: 18 (4:50 PM) RH% Min/Max: 5-36 Feel Min/Max: 67 to 89 | 02 High: 94.6994 Low: 69.78021 Precip: M Avg Wind: SE @ 6.7 Gust: 28 (7:40 PM) RH% Min/Max: 9-28 Feel Min/Max: 70 to 89 |
| 03 High: 96.40041 Low: 64.74919 Precip: M Avg Wind: SE @ 3.6 Gust: 13 (5:30 PM) RH% Min/Max: 6-41 Feel Min/Max: 65 to 90 | 04 High: 96.499405 Low: 71.360596 Precip: M Avg Wind: SSE @ 5.6 Gust: 20 (7:40 PM) RH% Min/Max: 5-28 Feel Min/Max: 71 to 90 | 05 High: 95.5994 Low: 67.3196 Precip: M Avg Wind: SSE @ 3.9 Gust: 17 (5:20 PM) RH% Min/Max: 6-26 Feel Min/Max: 67 to 89 | 06 High: 98.70079 Low: 70.89082 Precip: M Avg Wind: SSE @ 5.4 Gust: 23 (12:40 PM) RH% Min/Max: 8-28 Feel Min/Max: 71 to 93 | 07 High: 96.69919 Low: 76.36998 Precip: M Avg Wind: S @ 6.2 Gust: 22 (3:00 PM) RH% Min/Max: 8-26 Feel Min/Max: 76 to 92 | 08 High: 87.499405 Low: 68.95937 Precip: M Avg Wind: NW @ 4.8 Gust: 19 (7:20 PM) RH% Min/Max: 11-45 Feel Min/Max: 69 to 84 | 09 High: 83.19919 Low: 61.739594 Precip: M Avg Wind: N @ 4.7 Gust: 19 (3:50 PM) RH% Min/Max: 12-27 Feel Min/Max: 62 to 81 |
| 10 High: 87.000786 Low: 57.399776 Precip: M Avg Wind: NNE @ 4.9 Gust: 22 (6:50 PM) RH% Min/Max: 12-30 Feel Min/Max: 57 to 83 | 11 High: 91.70058 Low: 63.3002 Precip: M Avg Wind: NNW @ 5.3 Gust: 24 (6:40 PM) RH% Min/Max: 14-36 Feel Min/Max: 63 to 87 | 12 High: 96.299614 Low: 66.99018 Precip: M Avg Wind: N @ 3.7 Gust: 16 (7:50 AM) RH% Min/Max: 12-52 Feel Min/Max: 67 to 92 | 13 High: 102.30079 Low: 68.0792 Precip: M Gust: 28 (9:00 PM) RH% Min/Max: 8-43 Feel Min/Max: 68 to 96 | 14 Precip: M | 15 Precip: M | 16 |
| 17 | 18 | 19 | 20 | 21 | 22 | 23 |
| 24 | 25 | 26 | 27 | 28 | 29 | 30 |
| 31 | 01 | 02 | 03 | 04 | 05 | 06 |
The data presented here provided by IEM API webservice: daily.json. A simple CSV option exists as well.
Daily High/Low Plot
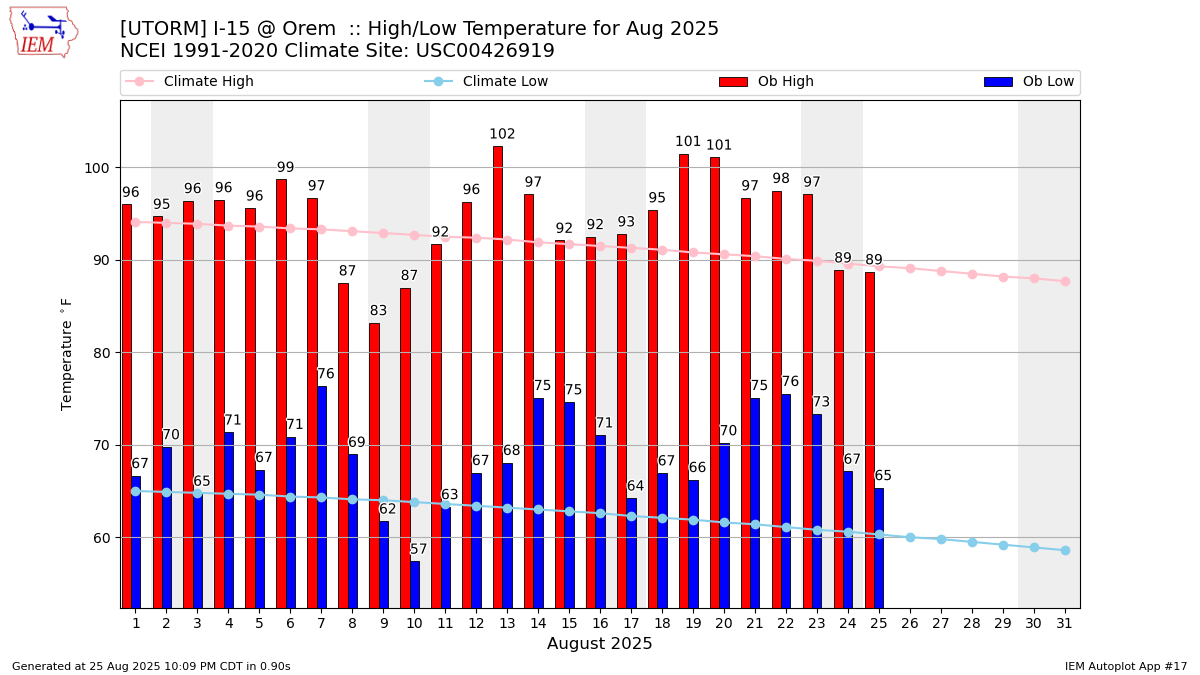
Description: This chart of the monthly temperature data. The bars are the observations and the dots are climatology.
Daily Rainfall
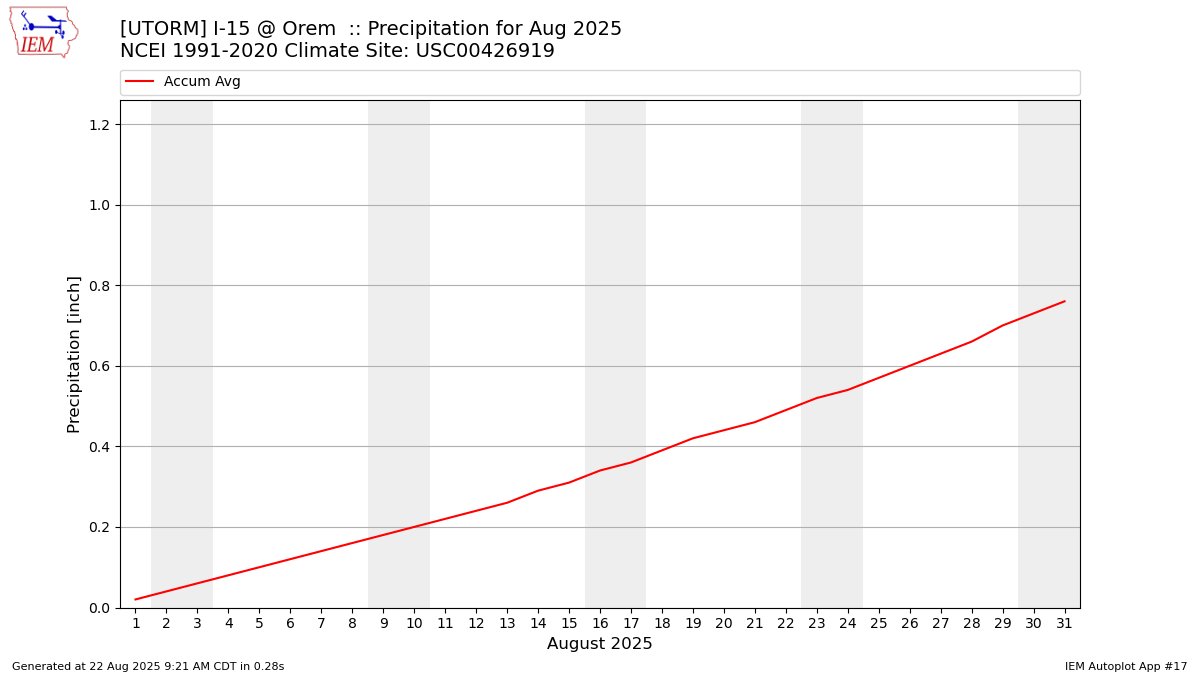
Description: This chart is of daily precipitation for the month. The red line would be an average month while the blue line and bars are observations.
Daily Average Wind Speeds

Description: This chart is of the daily average wind speeds.
The data presented here provided by IEM API webservice: daily.json. A simple CSV option exists as well.