| May 2025 | Jun 2025 | Jul 2025 | ||||
|---|---|---|---|---|---|---|
| Sunday | Monday | Tuesday | Wednesday | Thursday | Friday | Saturday |
| 01 High: 92.49978 Low: 63.629627 Precip: M Avg Wind: S @ 7.7 Gust: 35 (6:10 PM) RH% Min/Max: 11-28 Feel Min/Max: 64 to 88 | 02 High: 77.84962 Low: 63.150787 Precip: M Avg Wind: NNW @ 10.7 Gust: 31 (5:10 PM) RH% Min/Max: 11-47 Feel Min/Max: 63 to 78 | 03 High: 74.22979 Low: 53.38043 Precip: M Avg Wind: NNW @ 7.7 Gust: 34 (2:50 PM) RH% Min/Max: 17-31 Feel Min/Max: 53 to 74 | 04 High: 73.14983 Low: 53.04919 Precip: M Avg Wind: NNW @ 7.4 Gust: 27 (5:20 PM) RH% Min/Max: 21-39 Feel Min/Max: 53 to 73 | 05 High: 76.71918 Low: 54.3002 Precip: M Avg Wind: NNW @ 7.5 Gust: 25 (5:20 PM) RH% Min/Max: 19-39 Feel Min/Max: 54 to 77 | 06 High: 78.96023 Low: 60.61998 Precip: M Avg Wind: NNW @ 7.9 Gust: 30 (5:40 PM) RH% Min/Max: 17-55 Feel Min/Max: 61 to 79 | 07 High: 84.09919 Low: 61.849403 Precip: M Avg Wind: N @ 8.4 Gust: 26 (5:40 PM) RH% Min/Max: 16-45 Feel Min/Max: 62 to 81 |
| 08 High: 87.40041 Low: 64.41982 Precip: M Avg Wind: NNW @ 7.6 Gust: 35 (3:30 PM) RH% Min/Max: 15-34 Feel Min/Max: 64 to 84 | 09 High: 89.70079 Low: 66.540184 Precip: M Avg Wind: NNW @ 4.8 Gust: 26 (2:30 PM) RH% Min/Max: 14-40 Feel Min/Max: 67 to 86 | 10 High: 91.39999 Low: 69.920616 Precip: M Avg Wind: ESE @ 5.9 Gust: 21 (2:00 PM) RH% Min/Max: 15-32 Feel Min/Max: 70 to 87 | 11 High: 95.79919 Low: 67.71023 Precip: M Avg Wind: S @ 11.3 Gust: 32 (2:20 PM) RH% Min/Max: 10-36 Feel Min/Max: 68 to 91 | 12 High: 89.59999 Low: 66.63021 Precip: M Avg Wind: NNE @ 7.6 Gust: 27 (1:20 PM) RH% Min/Max: 16-44 Feel Min/Max: 67 to 86 | 13 High: 93.09919 Low: 63.699776 Precip: M Avg Wind: SSE @ 9.3 Gust: 33 (2:40 PM) RH% Min/Max: 7-48 Feel Min/Max: 64 to 87 | 14 High: 93.9002 Low: 69.810814 Precip: M Avg Wind: SE @ 10.4 Gust: 28 (2:20 PM) RH% Min/Max: 8-20 Feel Min/Max: 70 to 88 |
| 15 High: 93.7994 Low: 73.31001 Precip: M Avg Wind: SE @ 11.6 Gust: 28 (12:30 PM) RH% Min/Max: 7-21 Feel Min/Max: 73 to 88 | 16 High: 88.59919 Low: 67.62019 Precip: M Avg Wind: NW @ 7.3 Gust: 26 (2:40 PM) RH% Min/Max: 9-28 Feel Min/Max: 68 to 85 | 17 High: 83.19919 Low: 67.04061 Precip: M Avg Wind: NNW @ 9.4 Gust: 60 (1:00 AM) RH% Min/Max: 11-34 Feel Min/Max: 67 to 80 | 18 High: 91.500786 Low: 67.99999 Precip: M Avg Wind: SE @ 6.4 Gust: 20 (12:30 PM) RH% Min/Max: 14-28 Feel Min/Max: 68 to 87 | 19 High: 100.0994 Low: 71.90057 Precip: M Avg Wind: S @ 13.7 Gust: 46 (2:00 PM) RH% Min/Max: 5-27 Feel Min/Max: 72 to 92 | 20 High: 93.09919 Low: 63.539597 Precip: M Avg Wind: S @ 18.0 Gust: 54 (11:10 PM) RH% Min/Max: 7-40 Feel Min/Max: 64 to 87 | 21 High: 71.580215 Low: 53.40921 Precip: M Avg Wind: NNW @ 12.5 Gust: 47 (9:30 PM) RH% Min/Max: 22-46 Feel Min/Max: 53 to 72 |
| 22 High: 61.509212 Low: 42.560596 Precip: M Avg Wind: N @ 7.9 Gust: 30 (12:00 AM) RH% Min/Max: 28-95 Feel Min/Max: 37 to 62 | 23 High: 71.70079 Low: 50.28981 Precip: M Avg Wind: NNW @ 7.3 Gust: 20 (6:00 PM) RH% Min/Max: 18-42 Feel Min/Max: 50 to 72 | 24 High: 80.70079 Low: 60.769394 Precip: M Avg Wind: NNW @ 6.7 Gust: 23 (6:10 PM) RH% Min/Max: 17-34 Feel Min/Max: 61 to 80 | 25 High: 82.70058 Low: 62.650417 Precip: M Avg Wind: NNW @ 7.6 Gust: 22 (6:00 PM) RH% Min/Max: 16-30 Feel Min/Max: 63 to 80 | 26 High: 90.800575 Low: 71.470406 Precip: M Avg Wind: SE @ 9.9 Gust: 30 (1:30 PM) RH% Min/Max: 9-28 Feel Min/Max: 71 to 86 | 27 High: 92.49978 Low: 72.710594 Precip: M Avg Wind: SE @ 11.0 Gust: 29 (5:10 AM) RH% Min/Max: 8-21 Feel Min/Max: 73 to 87 | 28 High: 90.3002 Low: 70.59919 Precip: M Avg Wind: ENE @ 7.4 Gust: 21 (4:30 PM) RH% Min/Max: 15-24 Feel Min/Max: 71 to 86 |
| 29 High: 76.670616 Low: 70.01961 Precip: M Gust: 11 (2:20 AM) RH% Min/Max: 23-31 Feel Min/Max: 70 to 77 | 30 Precip: M | 01 | 02 | 03 | 04 | 05 |
The data presented here provided by IEM API webservice: daily.json. A simple CSV option exists as well.
Daily High/Low Plot
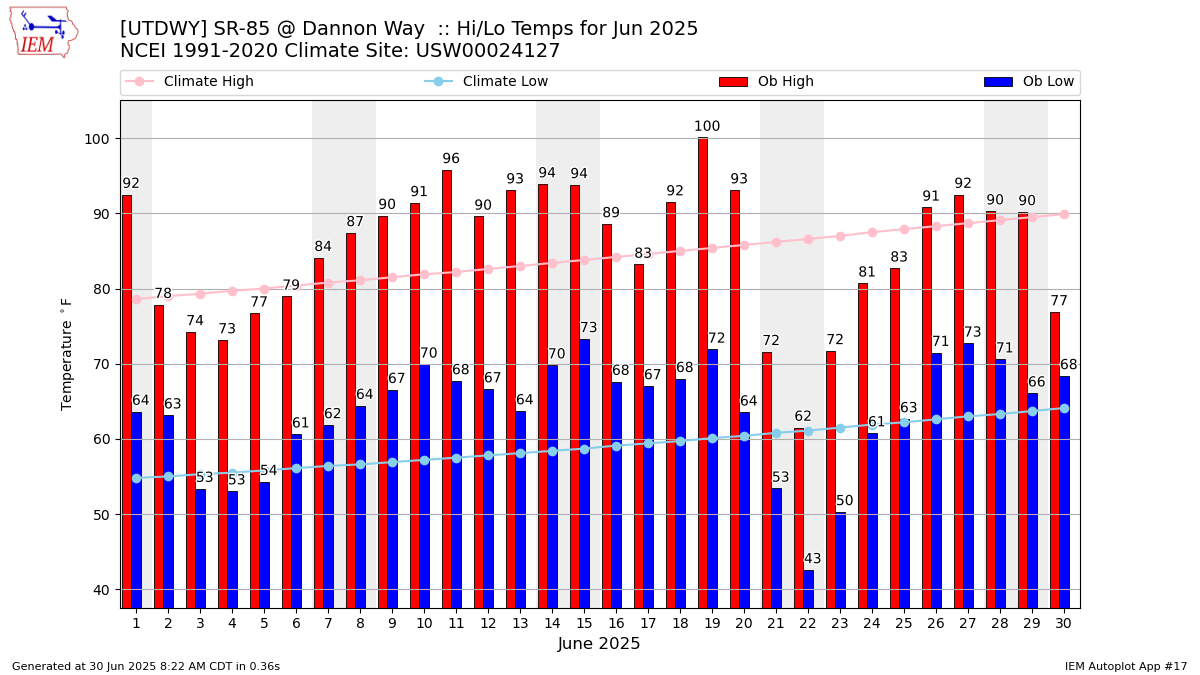
Description: This chart of the monthly temperature data. The bars are the observations and the dots are climatology.
Daily Rainfall

Description: This chart is of daily precipitation for the month. The red line would be an average month while the blue line and bars are observations.
Daily Average Wind Speeds
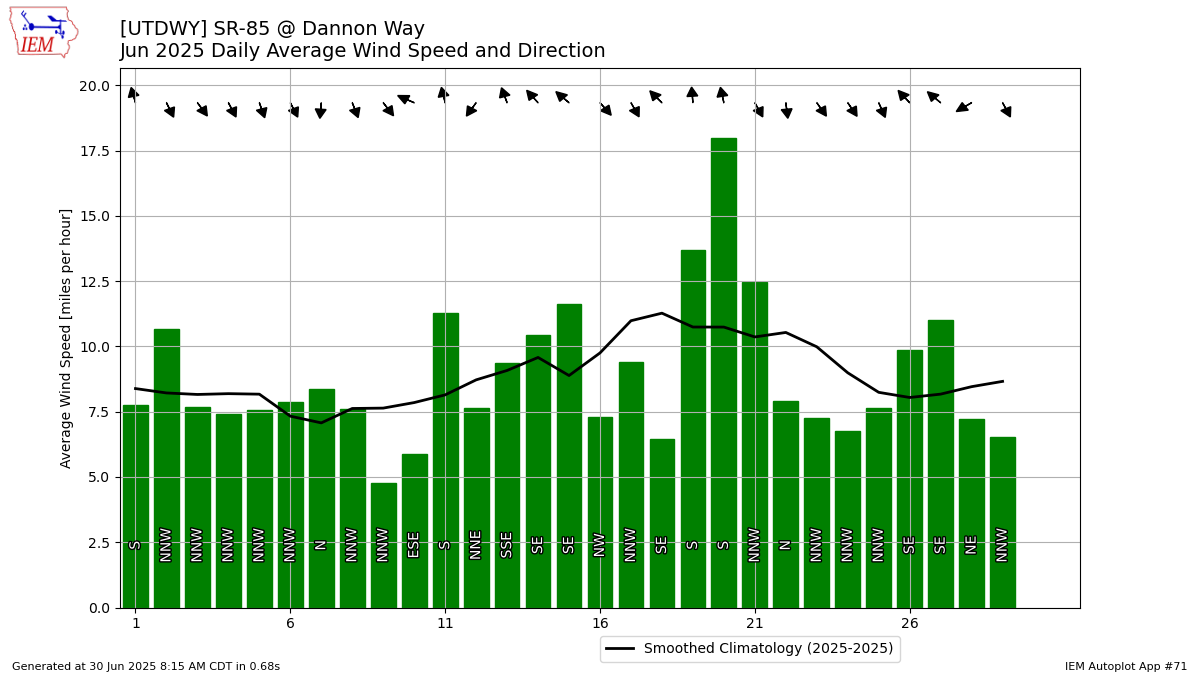
Description: This chart is of the daily average wind speeds.
The data presented here provided by IEM API webservice: daily.json. A simple CSV option exists as well.