| May 2025 | Jun 2025 | Jul 2025 | ||||
|---|---|---|---|---|---|---|
| Sunday | Monday | Tuesday | Wednesday | Thursday | Friday | Saturday |
| 01 High: 63.370407 Low: 47.800415 Precip: M Avg Wind: W @ 5.1 Gust: 23 (12:40 PM) RH% Min/Max: 23-62 Feel Min/Max: 45 to 63 | 02 High: 49.920776 Low: 43.5308 Precip: M Avg Wind: W @ 5.0 Gust: 17 (3:40 PM) RH% Min/Max: 55-95 Feel Min/Max: 39 to 49 | 03 High: 53.85921 Low: 40.920776 Precip: M Avg Wind: W @ 8.0 Gust: 26 (4:10 PM) RH% Min/Max: 32-96 Feel Min/Max: 34 to 54 | 04 High: 48.869606 Low: 36.660225 Precip: M Avg Wind: W @ 6.0 Gust: 26 (5:10 PM) RH% Min/Max: 52-91 Feel Min/Max: 28 to 47 | 05 High: 51.459797 Low: 34.890823 Precip: M Avg Wind: W @ 6.3 Gust: 24 (12:20 AM) RH% Min/Max: 52-97 Feel Min/Max: 28 to 51 | 06 High: 53.94018 Low: 38.969604 Precip: M Avg Wind: W @ 5.2 Gust: 19 (3:10 PM) RH% Min/Max: 41-85 Feel Min/Max: 35 to 54 | 07 High: 59.160225 Low: 40.319607 Precip: M Avg Wind: WNW @ 3.7 Gust: 24 (3:30 PM) RH% Min/Max: 35-71 Feel Min/Max: 40 to 59 |
| 08 High: 59.23938 Low: 45.84018 Precip: M Avg Wind: NNW @ 4.6 Gust: 28 (12:00 PM) RH% Min/Max: 31-62 Feel Min/Max: 43 to 59 | 09 High: 62.630585 Low: 47.960598 Precip: M Avg Wind: N @ 10.6 Gust: 27 (8:20 AM) RH% Min/Max: 19-54 Feel Min/Max: 42 to 63 | 10 High: 64.779785 Low: 47.879627 Precip: M Avg Wind: WNW @ 6.5 Gust: 40 (11:00 PM) RH% Min/Max: 23-59 Feel Min/Max: 45 to 65 | 11 High: 63.3308 Low: 52.840393 Precip: M Avg Wind: SW @ 7.1 Gust: 34 (2:10 PM) RH% Min/Max: 22-45 Feel Min/Max: 53 to 63 | 12 High: 61.730587 Low: 50.880215 Precip: M Avg Wind: SW @ 8.9 Gust: 34 (4:30 PM) RH% Min/Max: 17-31 Feel Min/Max: 51 to 62 | 13 High: 60.74061 Low: 49.859585 Precip: M Avg Wind: SSW @ 9.2 Gust: 37 (5:40 PM) RH% Min/Max: 16-31 Feel Min/Max: 47 to 61 | 14 High: 64.70058 Low: 49.260223 Precip: M Avg Wind: SW @ 6.1 Gust: 23 (6:00 PM) RH% Min/Max: 12-26 Feel Min/Max: 47 to 65 |
| 15 High: 66.14061 Low: 50.399616 Precip: M Avg Wind: SW @ 5.5 Gust: 28 (3:00 PM) RH% Min/Max: 6-24 Feel Min/Max: 50 to 66 | 16 High: 64.95079 Low: 52.610012 Precip: M Avg Wind: SW @ 8.9 Gust: 38 (6:00 PM) RH% Min/Max: 7-14 Feel Min/Max: 53 to 65 | 17 High: 62.259796 Low: 47.980427 Precip: M Avg Wind: N @ 7.6 Gust: 28 (1:10 AM) RH% Min/Max: 10-30 Feel Min/Max: 45 to 62 | 18 High: 67.92078 Low: 45.699776 Precip: M Avg Wind: SSW @ 3.4 Gust: 22 (4:40 PM) RH% Min/Max: 12-36 Feel Min/Max: 46 to 68 | 19 High: 67.17019 Low: 51.150204 Precip: M Avg Wind: SSW @ 9.9 Gust: 43 (2:30 PM) RH% Min/Max: 7-20 Feel Min/Max: 51 to 67 | 20 High: 61.170776 Low: 49.510384 Precip: M Avg Wind: SSW @ 19.1 Gust: 49 (11:50 AM) RH% Min/Max: 12-33 Feel Min/Max: 44 to 61 | 21 High: 57.57979 Low: 46.560226 Precip: M Avg Wind: SSW @ 19.0 Gust: 60 (4:40 PM) RH% Min/Max: 13-30 Feel Min/Max: 39 to 58 |
| 22 High: 50.230427 Low: 29.370192 Precip: M Avg Wind: SW @ 7.1 Gust: 38 (12:40 AM) RH% Min/Max: 13-79 Feel Min/Max: 23 to 50 | 23 High: 56.299988 Low: 36.550415 Precip: M Avg Wind: SSW @ 5.7 Gust: 24 (3:20 PM) RH% Min/Max: 17-31 Feel Min/Max: 35 to 56 | 24 High: 55.610596 Low: 37.50079 Precip: M Avg Wind: SSW @ 6.8 Gust: 31 (1:20 PM) RH% Min/Max: 21-50 Feel Min/Max: 37 to 56 | 25 High: 58.99999 Low: 41.439224 Precip: M Avg Wind: NNW @ 5.0 Gust: 17 (1:30 PM) RH% Min/Max: 20-40 Feel Min/Max: 39 to 59 | 26 High: 61.410225 Low: 42.51918 Precip: M Avg Wind: SSW @ 5.4 Gust: 22 (4:40 PM) RH% Min/Max: 14-34 Feel Min/Max: 41 to 61 | 27 High: 61.170776 Low: 48.54919 Precip: M Avg Wind: SW @ 6.0 Gust: 26 (4:50 PM) RH% Min/Max: 15-29 Feel Min/Max: 47 to 61 | 28 High: 64.81039 Low: 49.19002 Precip: M Gust: 22 (4:20 PM) RH% Min/Max: 19-36 Feel Min/Max: 47 to 65 |
| 29 Precip: M | 30 | 01 | 02 | 03 | 04 | 05 |
The data presented here provided by IEM API webservice: daily.json. A simple CSV option exists as well.
Daily High/Low Plot

Description: This chart of the monthly temperature data. The bars are the observations and the dots are climatology.
Daily Rainfall
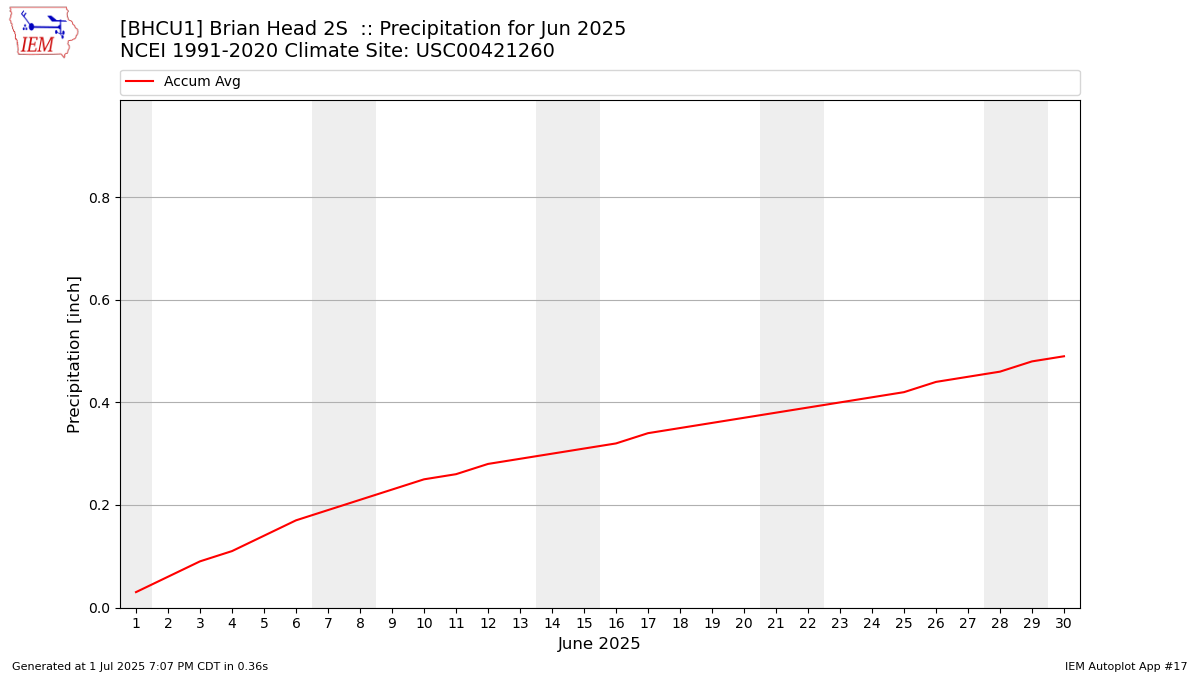
Description: This chart is of daily precipitation for the month. The red line would be an average month while the blue line and bars are observations.
Daily Average Wind Speeds
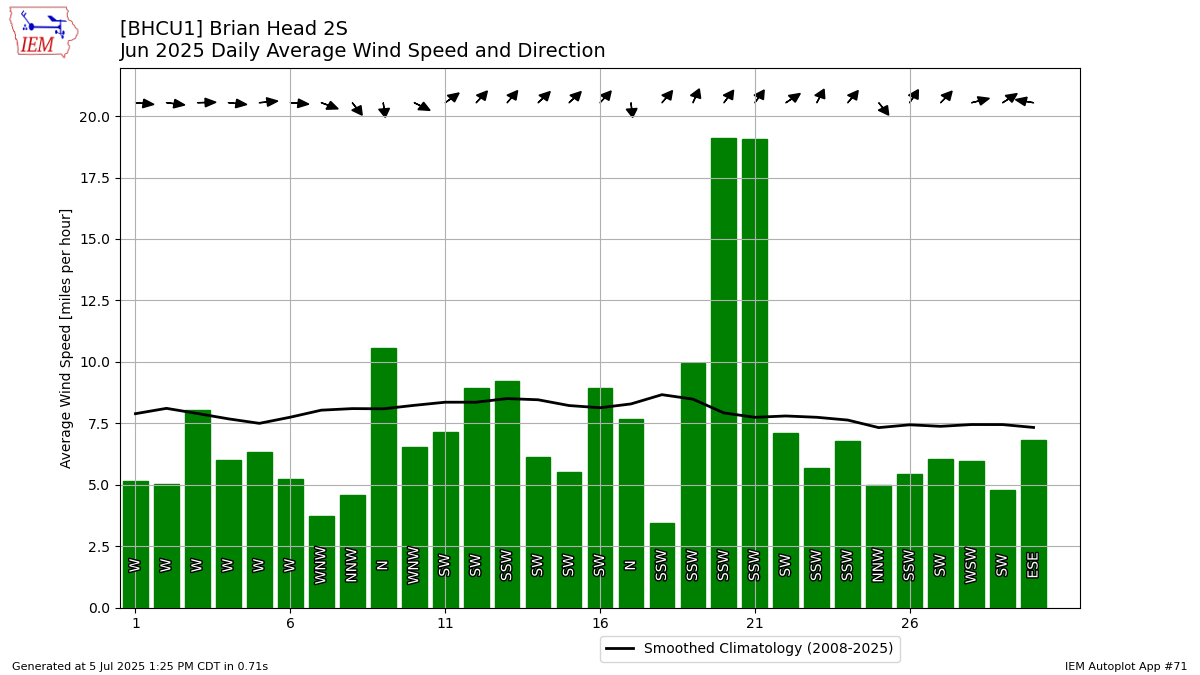
Description: This chart is of the daily average wind speeds.
The data presented here provided by IEM API webservice: daily.json. A simple CSV option exists as well.