| Jan 2026 | Feb 2026 | Mar 2026 | ||||
|---|---|---|---|---|---|---|
| Sunday | Monday | Tuesday | Wednesday | Thursday | Friday | Saturday |
| 01 High: 52.88 Low: 18.5 Precip: 0.00 Max Stage[ft]: 5.63 | 02 High: 69.62 Low: 25.88 Precip: 0.00 Max Stage[ft]: 5.26 | 03 High: 64.58 Low: 35.42 Precip: 0.00 Max Stage[ft]: 4.48 | 04 High: 52.34 Low: 31.46 Precip: 0.00 Max Stage[ft]: 4.50 | 05 High: 73.4 Low: 25.88 Precip: 0.00 Max Stage[ft]: 4.57 | 06 High: 71.78 Low: 38.84 Precip: 0.00 Max Stage[ft]: 4.59 | 07 High: 67.64 Low: 33.08 Precip: 0.00 Max Stage[ft]: 4.57 |
| 08 High: 82.76 Low: 40.1 Precip: 0.00 Max Stage[ft]: 4.60 | 09 High: 81.32 Low: 37.04 Precip: 0.00 Max Stage[ft]: 4.62 | 10 High: 62.24 Low: 45.68 Precip: 0.00 Max Stage[ft]: 4.61 | 11 Precip: M | 12 Precip: M | 13 | 14 |
| 15 | 16 | 17 | 18 | 19 | 20 | 21 |
| 22 | 23 | 24 | 25 | 26 | 27 | 28 |
The data presented here provided by IEM API webservice: daily.json. A simple CSV option exists as well.
Daily High/Low Plot
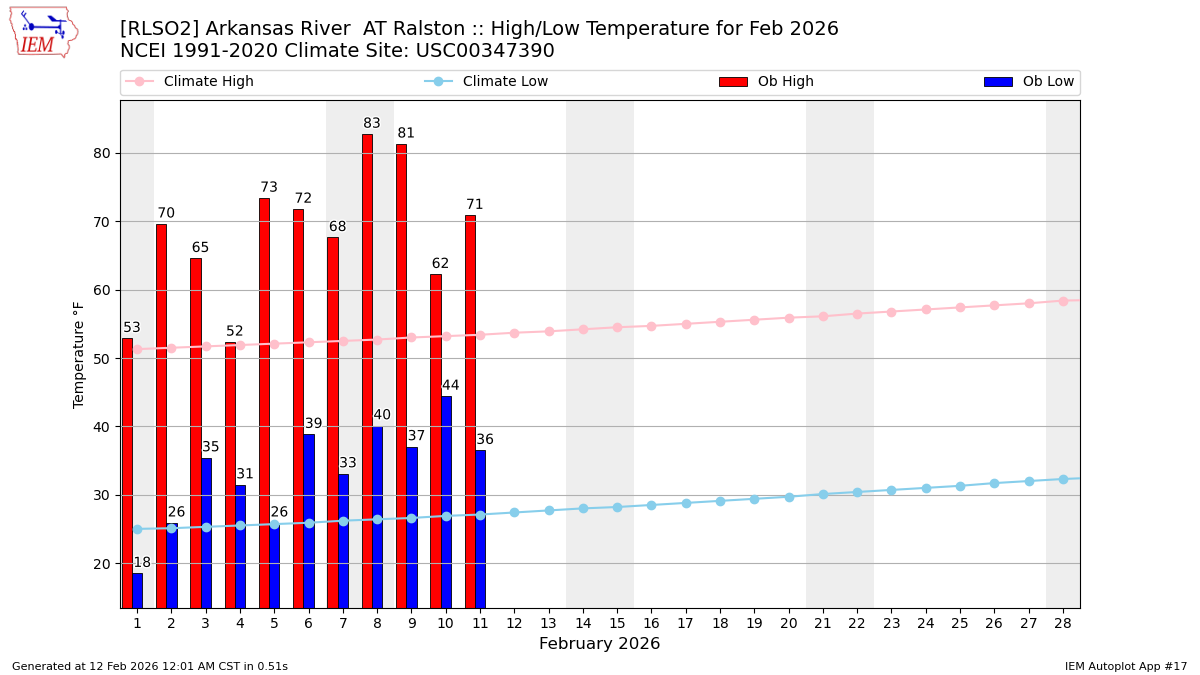
Description: This chart of the monthly temperature data. The bars are the observations and the dots are climatology.
Daily Rainfall
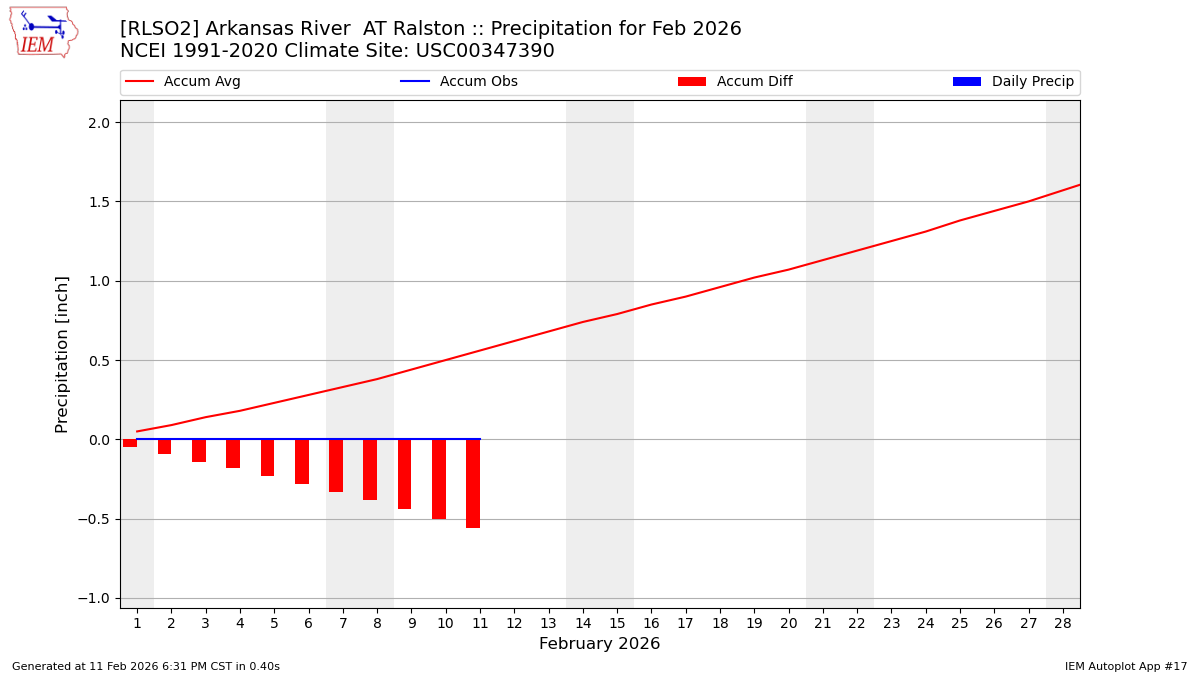
Description: This chart is of daily precipitation for the month. The red line would be an average month while the blue line and bars are observations.
Daily Average Wind Speeds
Description: This chart is of the daily average wind speeds.
The data presented here provided by IEM API webservice: daily.json. A simple CSV option exists as well.