| Aug 2025 | Sep 2025 | Oct 2025 | ||||
|---|---|---|---|---|---|---|
| Sunday | Monday | Tuesday | Wednesday | Thursday | Friday | Saturday |
| 31 | 01 High: 77.458336 Low: 57.807484 Precip: M | 02 High: 81.15152 Low: 54.005234 Precip: M | 03 High: 72.75522 Low: 50.83333 Precip: M | 04 High: 71.12691 Low: 44.297028 Precip: M | 05 High: 65.47492 Low: 49.783558 Precip: M | 06 High: 67.19524 Low: 44.156906 Precip: M |
| 07 High: 71.97206 Low: 41.88878 Precip: M | 08 High: 78.653625 Low: 49.491257 Precip: M | 09 High: 76.670906 Low: 54.091003 Precip: M | 10 High: 83.59055 Low: 56.23475 Precip: M | 11 High: 85.81052 Low: 56.19585 Precip: M | 12 High: 84.09452 Low: 59.591824 Precip: M | 13 High: 95.233406 Low: 66.90837 Precip: M |
| 14 High: 92.10259 Low: 63.59504 Precip: M | 15 High: 91.45724 Low: 68.65367 Precip: M | 16 High: 91.06725 Low: 63.70376 Precip: M | 17 High: 81.68295 Low: 62.442734 Precip: M | 18 High: 73.64597 Low: 61.672836 Precip: M | 19 Precip: M | 20 |
| 21 | 22 | 23 | 24 | 25 | 26 | 27 |
| 28 | 29 | 30 | 01 | 02 | 03 | 04 |
The data presented here provided by IEM API webservice: daily.json. A simple CSV option exists as well.
Daily High/Low Plot
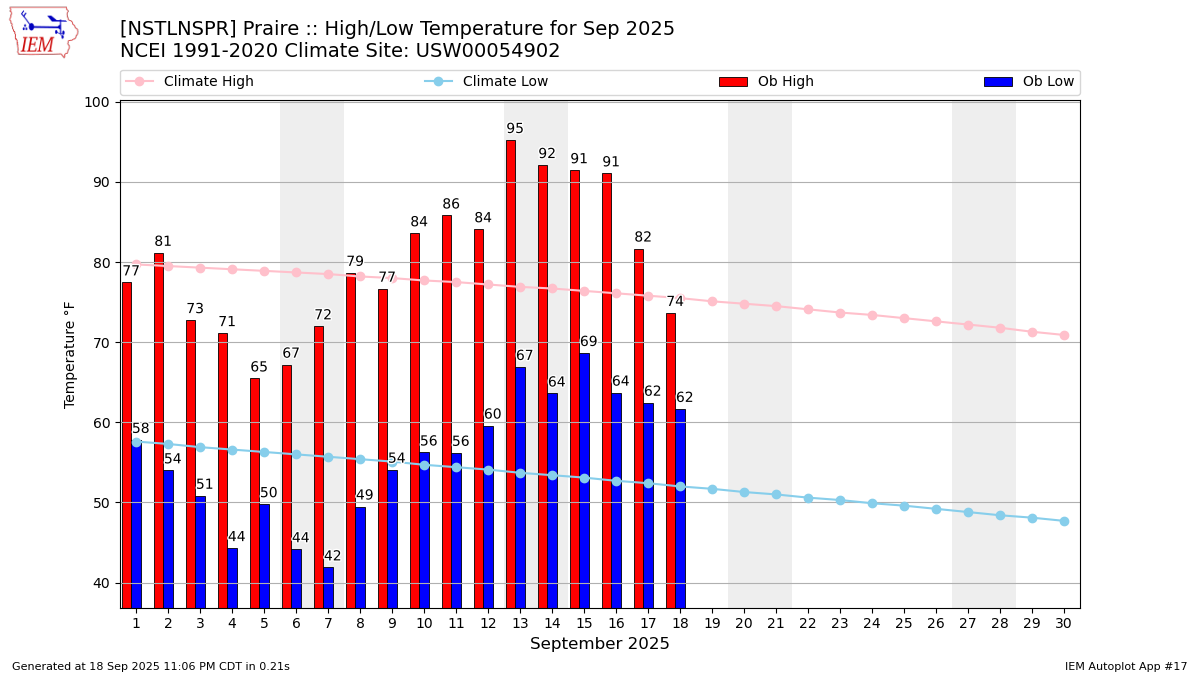
Description: This chart of the monthly temperature data. The bars are the observations and the dots are climatology.
Daily Rainfall
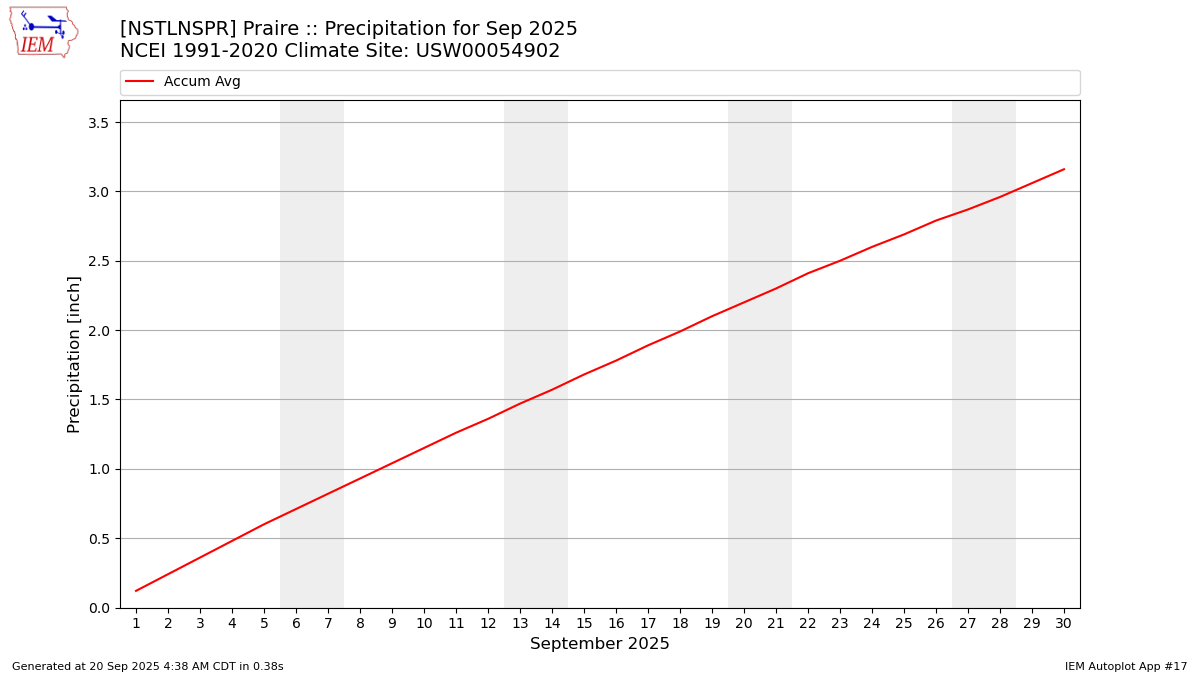
Description: This chart is of daily precipitation for the month. The red line would be an average month while the blue line and bars are observations.
Daily Average Wind Speeds
Description: This chart is of the daily average wind speeds.
The data presented here provided by IEM API webservice: daily.json. A simple CSV option exists as well.