| May 2025 | Jun 2025 | Jul 2025 | ||||
|---|---|---|---|---|---|---|
| Sunday | Monday | Tuesday | Wednesday | Thursday | Friday | Saturday |
| 01 High: 71.942 Low: 38.768 Precip: M RH% Min/Max: 19-82 Feel Min/Max: 36 to 72 | 02 High: 78.548 Low: 45.968 Precip: M RH% Min/Max: 23-78 Feel Min/Max: 44 to 79 | 03 High: 87.656 Low: 59.936 Precip: M RH% Min/Max: 36-60 Feel Min/Max: 60 to 86 | 04 High: 77.774 Low: 60.476 Precip: 4.80 RH% Min/Max: 54-96 Feel Min/Max: 60 to 78 | 05 High: 75.308 Low: 57.074 Precip: M RH% Min/Max: 30-89 Feel Min/Max: 57 to 75 | 06 High: 78.566 Low: 52.952 Precip: M RH% Min/Max: 24-87 Feel Min/Max: 53 to 79 | 07 High: 77.99 Low: 53.438 Precip: M RH% Min/Max: 28-79 Feel Min/Max: 53 to 78 |
| 08 High: 80.474 Low: 57.164 Precip: 2.60 RH% Min/Max: 32-95 Feel Min/Max: 57 to 80 | 09 High: 76.244 Low: 55.724 Precip: 10.30 RH% Min/Max: 34-98 Feel Min/Max: 56 to 76 | 10 High: 66.704 Low: 53.294 Precip: M RH% Min/Max: 61-85 Feel Min/Max: 53 to 67 | 11 High: 83.444 Low: 52.412 Precip: M RH% Min/Max: 35-96 Feel Min/Max: 52 to 83 | 12 High: 74.822 Low: 61.682 Precip: M RH% Min/Max: 48-83 Feel Min/Max: 62 to 75 | 13 High: 69.998 Low: 57.902 Precip: M RH% Min/Max: 41-78 Feel Min/Max: 58 to 70 | 14 High: 74.948 Low: 52.772 Precip: M RH% Min/Max: 45-89 Feel Min/Max: 53 to 75 |
| 15 High: 75.56 Low: 56.966 Precip: M RH% Min/Max: 41-86 Feel Min/Max: 57 to 76 | 16 High: 85.676 Low: 57.956 Precip: M RH% Min/Max: 34-84 Feel Min/Max: 58 to 84 | 17 High: 89.276 Low: 66.524 Precip: M RH% Min/Max: 43-87 Feel Min/Max: 67 to 91 | 18 High: 75.938 Low: 66.488 Precip: 14.60 RH% Min/Max: 75-98 Feel Min/Max: 66 to 76 | 19 High: 76.1 Low: 59.738 Precip: 7.00 RH% Min/Max: 64-99 Feel Min/Max: 60 to 76 | 20 High: 78.26 Low: 60.278 Precip: 1.50 RH% Min/Max: 70-98 Feel Min/Max: 60 to 78 | 21 High: 90.194 Low: 67.964 Precip: 1.10 RH% Min/Max: 55-93 Feel Min/Max: 68 to 98 |
| 22 Precip: M | 23 Precip: M | 24 | 25 | 26 | 27 | 28 |
| 29 | 30 | 01 | 02 | 03 | 04 | 05 |
The data presented here provided by IEM API webservice: daily.json. A simple CSV option exists as well.
Daily High/Low Plot
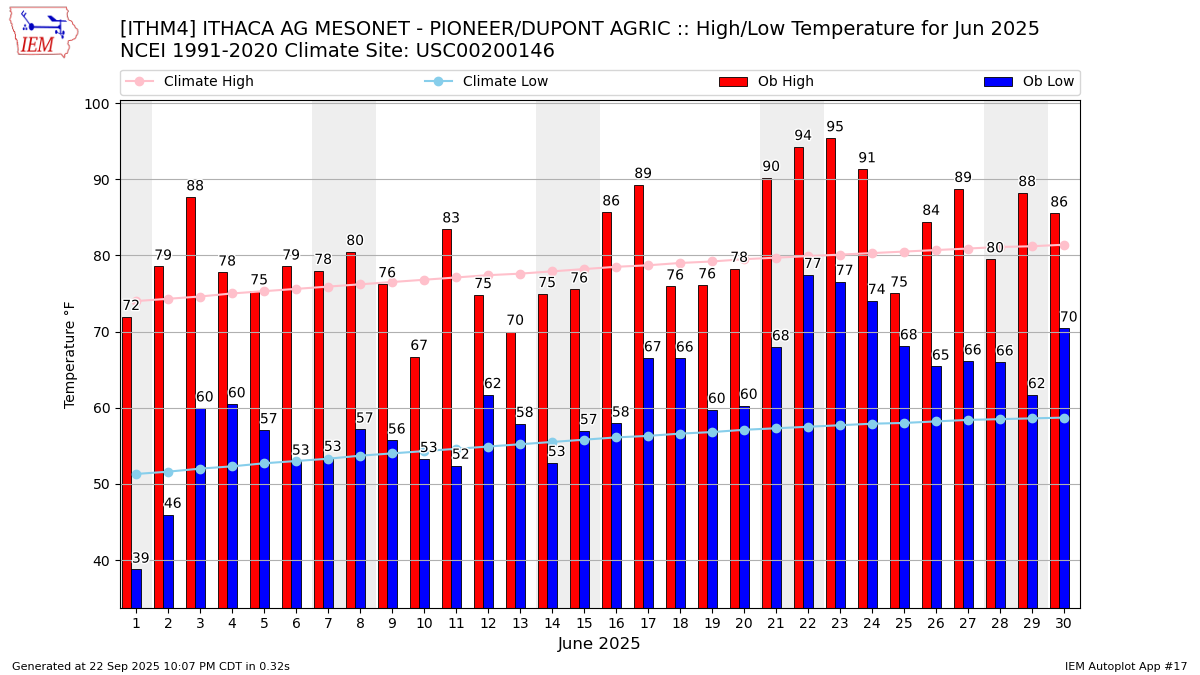
Description: This chart of the monthly temperature data. The bars are the observations and the dots are climatology.
Daily Rainfall

Description: This chart is of daily precipitation for the month. The red line would be an average month while the blue line and bars are observations.
Daily Average Wind Speeds

Description: This chart is of the daily average wind speeds.
The data presented here provided by IEM API webservice: daily.json. A simple CSV option exists as well.