| May 2025 | Jun 2025 | Jul 2025 | ||||
|---|---|---|---|---|---|---|
| Sunday | Monday | Tuesday | Wednesday | Thursday | Friday | Saturday |
| 01 High: 67.298 Low: 39.416 Precip: M RH% Min/Max: 37-77 Feel Min/Max: 38 to 67 | 02 High: 76.892 Low: 40.874 Precip: M RH% Min/Max: 31-86 Feel Min/Max: 41 to 77 | 03 High: 85.496 Low: 55.706 Precip: M RH% Min/Max: 48-66 Feel Min/Max: 56 to 87 | 04 High: 77.018 Low: 62.564 Precip: 6.70 RH% Min/Max: 63-92 Feel Min/Max: 63 to 77 | 05 High: 72.032 Low: 56.174 Precip: 4.00 RH% Min/Max: 50-93 Feel Min/Max: 56 to 72 | 06 High: 75.488 Low: 55.22 Precip: M RH% Min/Max: 43-82 Feel Min/Max: 55 to 75 | 07 High: 76.082 Low: 51.242 Precip: M RH% Min/Max: 46-82 Feel Min/Max: 51 to 76 |
| 08 High: 77.18 Low: 57.236 Precip: M RH% Min/Max: 51-76 Feel Min/Max: 57 to 77 | 09 High: 75.236 Low: 55.184 Precip: 3.30 RH% Min/Max: 40-90 Feel Min/Max: 55 to 75 | 10 High: 69.08 Low: 52.07 Precip: M RH% Min/Max: 56-86 Feel Min/Max: 52 to 69 | 11 High: 83.156 Low: 49.64 Precip: M RH% Min/Max: 45-94 Feel Min/Max: 50 to 84 | 12 High: 74.066 Low: 62.024 Precip: 0.50 RH% Min/Max: 55-84 Feel Min/Max: 62 to 74 | 13 High: 68.54 Low: 56.3 Precip: 1.10 RH% Min/Max: 54-87 Feel Min/Max: 56 to 69 | 14 High: 76.82 Low: 55.886 Precip: 1.10 RH% Min/Max: 52-92 Feel Min/Max: 56 to 77 |
| 15 High: 77.36 Low: 56.354 Precip: M RH% Min/Max: 49-83 Feel Min/Max: 56 to 77 | 16 High: 81.968 Low: 58.604 Precip: M RH% Min/Max: 49-86 Feel Min/Max: 59 to 83 | 17 High: 85.532 Low: 64.364 Precip: M RH% Min/Max: 54-88 Feel Min/Max: 64 to 89 | 18 High: 76.802 Low: 66.434 Precip: 12.80 RH% Min/Max: 77-92 Feel Min/Max: 66 to 77 | 19 High: 75.308 Low: 60.476 Precip: 6.50 RH% Min/Max: 60-94 Feel Min/Max: 60 to 75 | 20 High: 78.386 Low: 59 Precip: M RH% Min/Max: 64-94 Feel Min/Max: 59 to 78 | 21 High: 89.924 Low: 72.572 Precip: M RH% Min/Max: 55-76 Feel Min/Max: 73 to 98 |
| 22 High: 92.426 Low: 78.494 Precip: M RH% Min/Max: 52-80 Feel Min/Max: 78 to 101 | 23 High: 92.516 Low: 77.882 Precip: M RH% Min/Max: 48-80 Feel Min/Max: 78 to 99 | 24 High: 88.574 Low: 75.794 Precip: M RH% Min/Max: 60-88 Feel Min/Max: 76 to 96 | 25 High: 79.106 Low: 70.052 Precip: M RH% Min/Max: 73-92 Feel Min/Max: 70 to 79 | 26 High: 84.074 Low: 67.514 Precip: M RH% Min/Max: 72-93 Feel Min/Max: 68 to 92 | 27 High: 87.908 Low: 70.052 Precip: 10.20 RH% Min/Max: 60-92 Feel Min/Max: 70 to 95 | 28 High: 78.26 Low: 67.892 Precip: M RH% Min/Max: 59-91 Feel Min/Max: 68 to 78 |
| 29 High: 67.1 Low: 61.034 Precip: M RH% Min/Max: 85-94 Feel Min/Max: 61 to 67 | 30 Precip: M | 01 | 02 | 03 | 04 | 05 |
The data presented here provided by IEM API webservice: daily.json. A simple CSV option exists as well.
Daily High/Low Plot
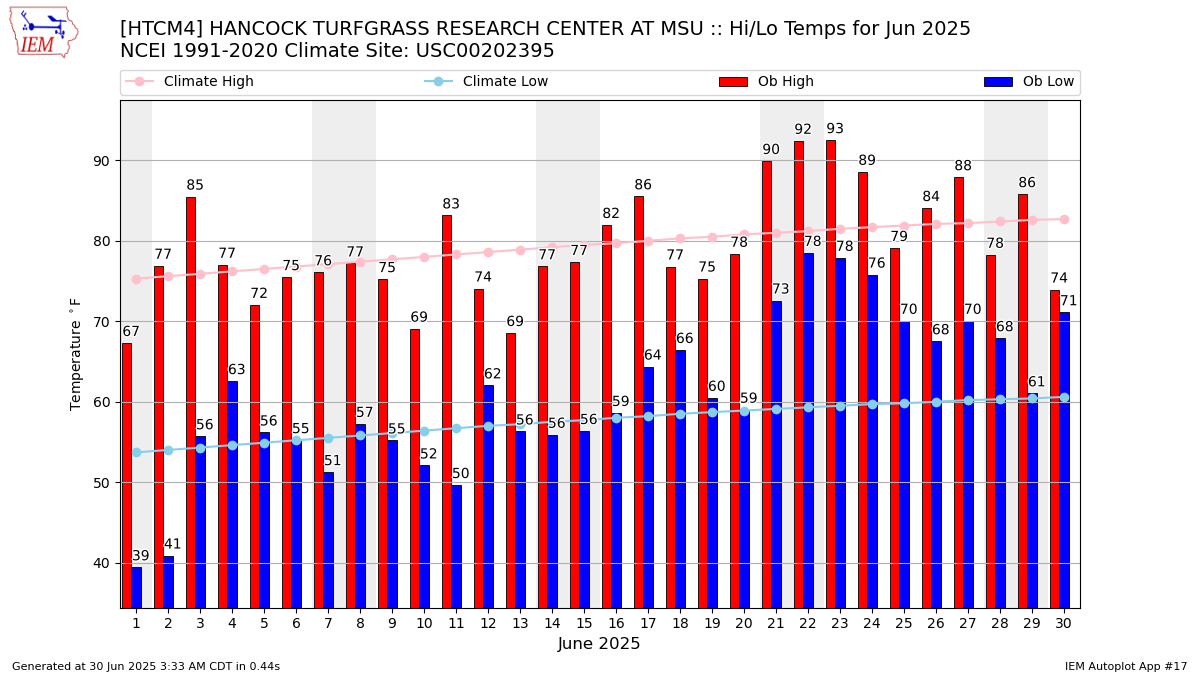
Description: This chart of the monthly temperature data. The bars are the observations and the dots are climatology.
Daily Rainfall

Description: This chart is of daily precipitation for the month. The red line would be an average month while the blue line and bars are observations.
Daily Average Wind Speeds

Description: This chart is of the daily average wind speeds.
The data presented here provided by IEM API webservice: daily.json. A simple CSV option exists as well.