| May 2025 | Jun 2025 | Jul 2025 | ||||
|---|---|---|---|---|---|---|
| Sunday | Monday | Tuesday | Wednesday | Thursday | Friday | Saturday |
| 01 High: 67.58059 Low: 46.49002 Precip: M Avg Wind: N @ 1.1 RH% Min/Max: 43-88 Feel Min/Max: 46 to 68 | 02 High: 75.0308 Low: 47.949776 Precip: M Avg Wind: N @ 1.0 RH% Min/Max: 38-94 Feel Min/Max: 48 to 75 | 03 High: 83.49082 Low: 46.95079 Precip: M Avg Wind: SSE @ 1.0 RH% Min/Max: 27-95 Feel Min/Max: 47 to 82 | 04 High: 87.08 Low: 50.88922 Precip: M Avg Wind: SSE @ 1.3 RH% Min/Max: 43-94 Feel Min/Max: 51 to 88 | 05 High: 91.669975 Low: 58.719177 Precip: M Avg Wind: SSE @ 1.2 RH% Min/Max: 45-96 Feel Min/Max: 59 to 99 | 06 High: 88.75042 Low: 66.4106 Precip: M Avg Wind: SSE @ 1.2 RH% Min/Max: 53-96 Feel Min/Max: 66 to 95 | 07 High: 76.780426 Low: 64.45042 Precip: M Avg Wind: SSW @ 0.6 RH% Min/Max: 86-97 Feel Min/Max: 64 to 77 |
| 08 High: 78.90079 Low: 60.060226 Precip: M Avg Wind: SSE @ 1.2 RH% Min/Max: 60-97 Feel Min/Max: 60 to 79 | 09 High: 64.189384 Low: 61.069977 Precip: M Avg Wind: SE @ 1.1 RH% Min/Max: 89-96 Feel Min/Max: 61 to 64 | 10 High: 71.470406 Low: 62.38043 Precip: M Avg Wind: SSE @ 0.8 RH% Min/Max: 92-97 Feel Min/Max: 62 to 71 | 11 High: 84.41961 Low: 58.479786 Precip: M Avg Wind: NNE @ 0.8 RH% Min/Max: 42-97 Feel Min/Max: 58 to 86 | 12 High: 90.89061 Low: 59.480587 Precip: M Avg Wind: N @ 0.8 RH% Min/Max: 41-96 Feel Min/Max: 59 to 95 | 13 High: 81.86001 Low: 61.53981 Precip: M Avg Wind: SSE @ 1.0 RH% Min/Max: 37-86 Feel Min/Max: 62 to 82 | 14 High: 65.28922 Low: 59.61918 Precip: M Avg Wind: NNE @ 0.8 RH% Min/Max: 80-92 Feel Min/Max: 60 to 65 |
| 15 High: 68.77941 Low: 58.8308 Precip: M Avg Wind: SE @ 0.9 RH% Min/Max: 63-87 Feel Min/Max: 59 to 69 | 16 High: 72.14002 Low: 60.63981 Precip: M Avg Wind: SE @ 1.1 RH% Min/Max: 68-93 Feel Min/Max: 61 to 72 | 17 High: 63.1292 Low: 62.630585 Precip: M RH% Min/Max: 94-96 Feel Min/Max: 63 to 63 | 18 Precip: M | 19 | 20 | 21 |
| 22 | 23 | 24 | 25 | 26 | 27 | 28 |
| 29 | 30 | 01 | 02 | 03 | 04 | 05 |
The data presented here provided by IEM API webservice: daily.json. A simple CSV option exists as well.
Daily High/Low Plot
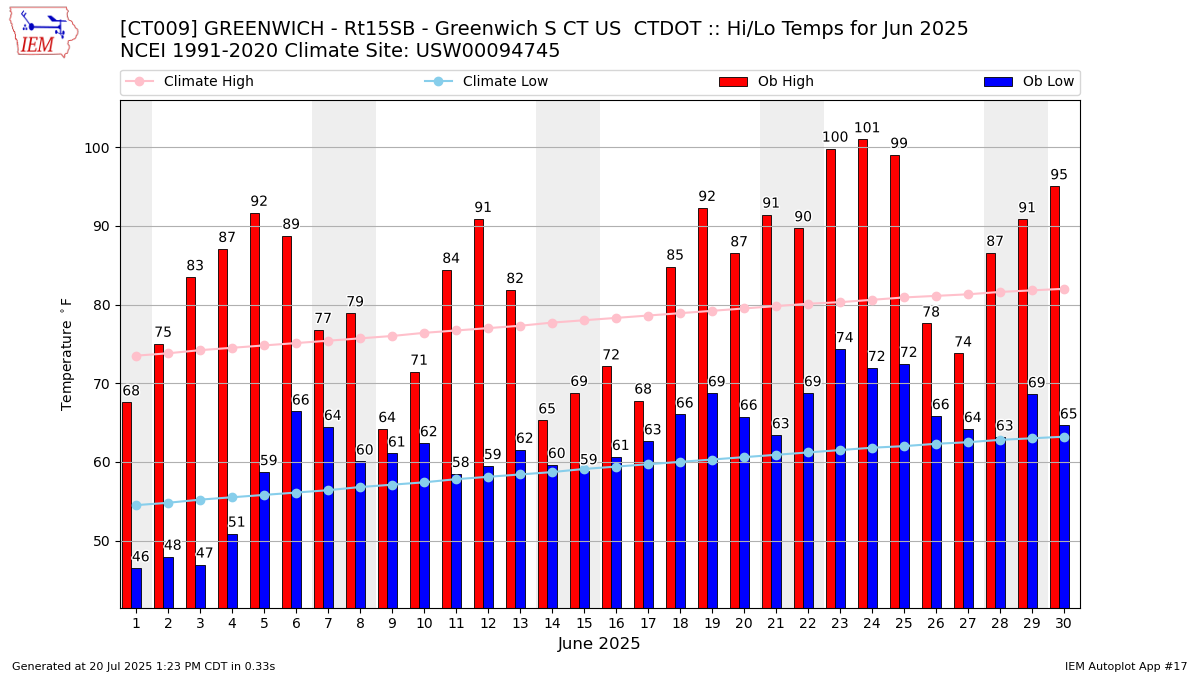
Description: This chart of the monthly temperature data. The bars are the observations and the dots are climatology.
Daily Rainfall
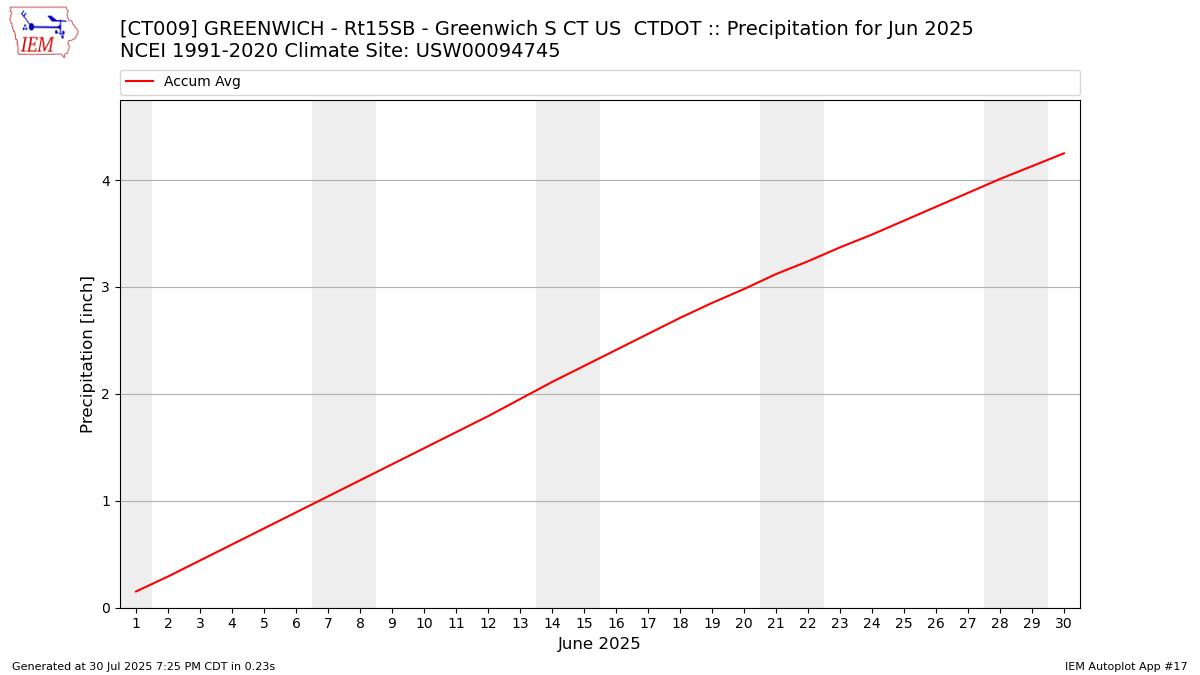
Description: This chart is of daily precipitation for the month. The red line would be an average month while the blue line and bars are observations.
Daily Average Wind Speeds
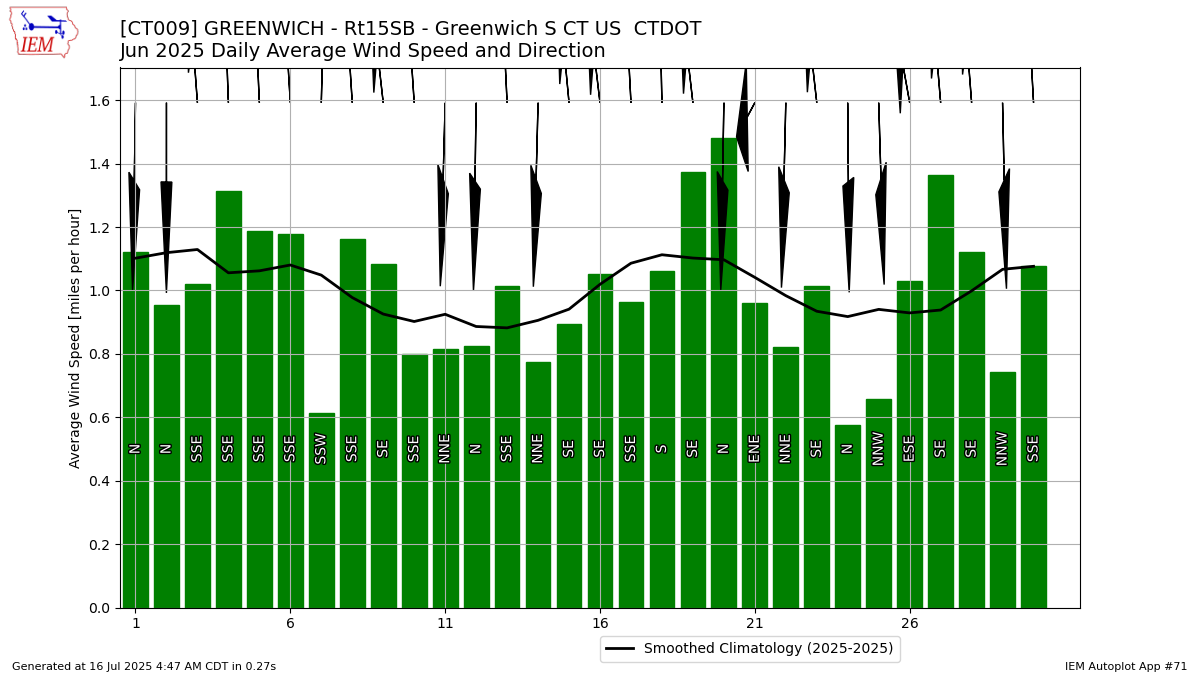
Description: This chart is of the daily average wind speeds.
The data presented here provided by IEM API webservice: daily.json. A simple CSV option exists as well.