Automated Data Plotter
This application dynamically generates many types of graphs derived from various IEM data sources. Feel free to use these generated graphics in whatever way you wish.
1 Select a Chart Type
2 Configure Chart Options
Plot Description:
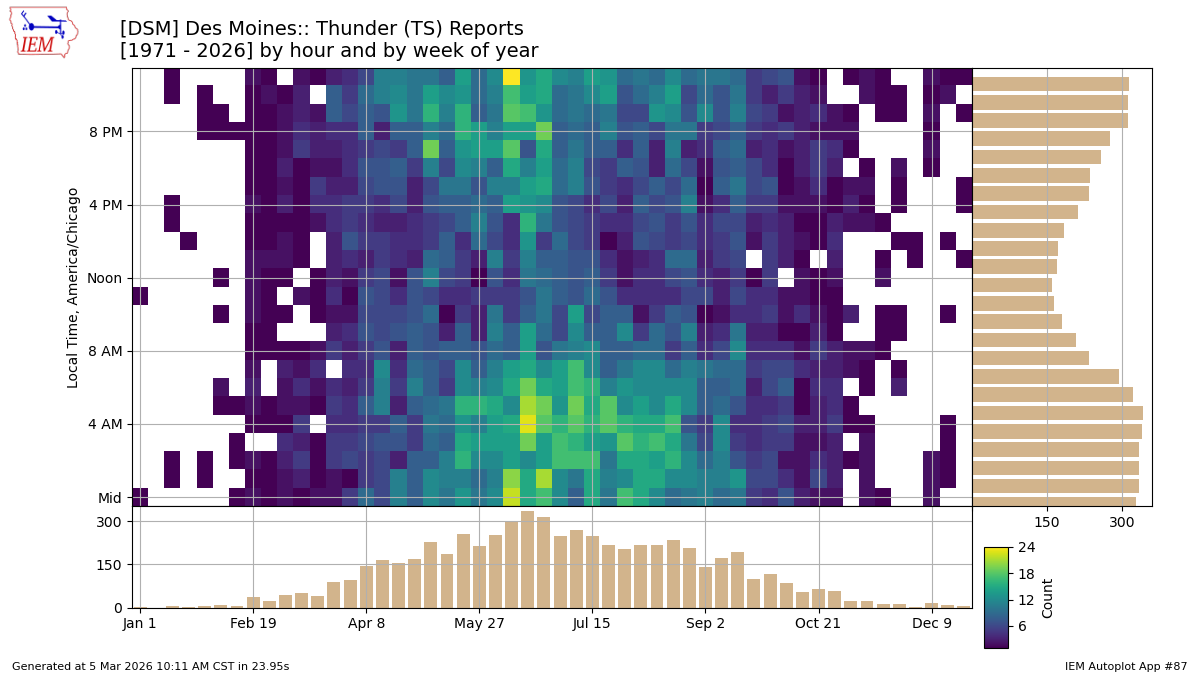
Frequency plot partitioned by hour and day or week of the year for a given METAR code to appear in the present weather. If your favorite METAR code is not available in the listing, please let us know! If multiple reports occurred within the same hour during one day/week, it would only count as one in this analysis. The plot title will contain the time period found with the given present weather code present.3 Generated Chart
Based on recent timings, plot generation averages 8 seconds. Please wait while your chart is being generated...
If you notice plotting issues with the image above, please
contact us
and provide the URL address currently shown by your web browser.
IEM Daily Features using this plot
The IEM Daily Features found on this website often utilize plots found on this application. Here is a listing of features referencing this plot type.
- 06 Mar 2026: Thunder Season
- 19 Jun 2024: June Peak of Thunder
- 13 Apr 2022: Thunder Season Just Starting
- 05 Jun 2020: Peak Thunder Season
- 07 Feb 2020: Light Snow Report Frequency
- 22 May 2018: Best Time for Fog
- 17 Aug 2016: Fog Frequency
- 16 Jul 2015: Thunder by Hour
- 19 Apr 2012: Thunder Climatology