Automated Data Plotter
This application dynamically generates many types of graphs derived from various IEM data sources. Feel free to use these generated graphics in whatever way you wish.
1 Select a Chart Type
2 Configure Chart Options
Plot Description:
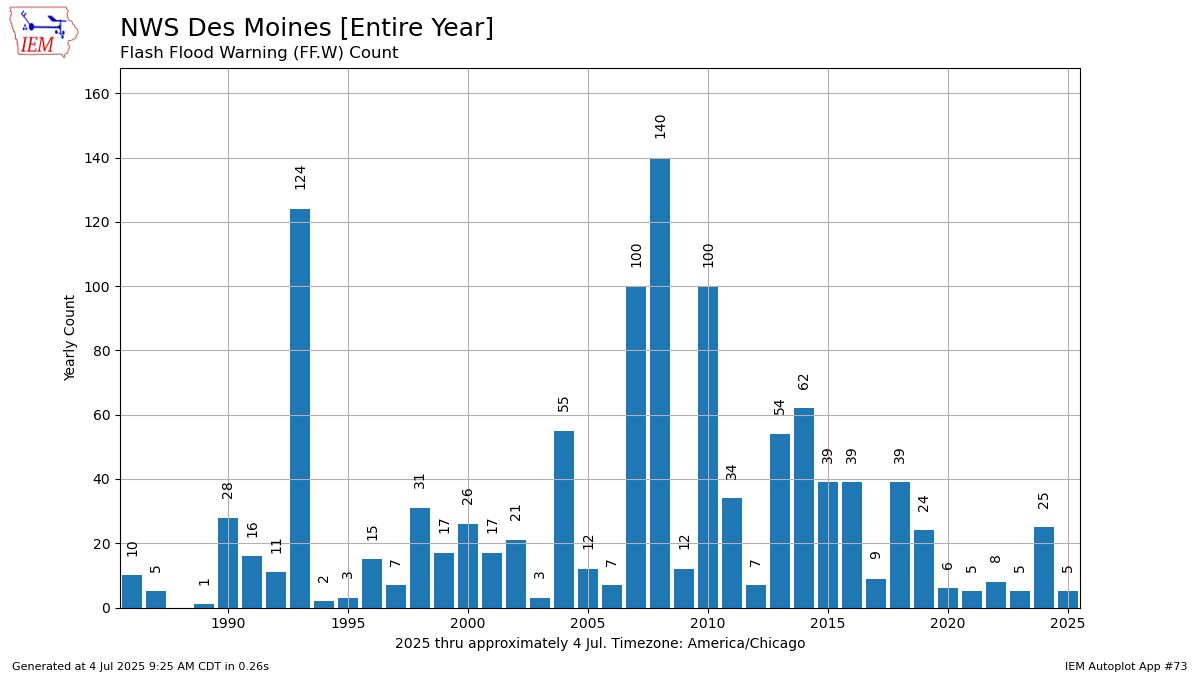
This chart displays the number of products issued by a NWS Office or state by year for a given watch, warning, or advisory of your choice. These numbers are based on IEM archives and are not official! The counting is summing up distinct events. If one tornado watch covered 40 counties, this would only count as 1 for this plot.Since the year 2005 and 2008 are common start years for VTEC tracking of various phenomena, when this app encounters those years as the starting point of the plot, they are droppped from the display.
3 Generated Chart
Based on recent timings, plot generation averages 2 seconds. Please wait while your chart is being generated...
If you notice plotting issues with the image above, please
contact us
and provide the URL address currently shown by your web browser.
IEM Daily Features using this plot
The IEM Daily Features found on this website often utilize plots found on this application. Here is a listing of features referencing this plot type.
- 10 Dec 2025: High Wind Warnings
- 18 Apr 2024: YTD Tornado Warning Counts
- 25 Mar 2022: Flash Flood Warnings
- 21 Aug 2020: Flood Warning Counts
- 08 Jan 2019: Wind Advisory Counts
- 26 May 2017: Most since 2006
- 25 May 2015: Norman Flash Flood Warnings