Automated Data Plotter
This application dynamically generates many types of graphs derived from various IEM data sources. Feel free to use these generated graphics in whatever way you wish.
1 Select a Chart Type
2 Configure Chart Options
Plot Description:
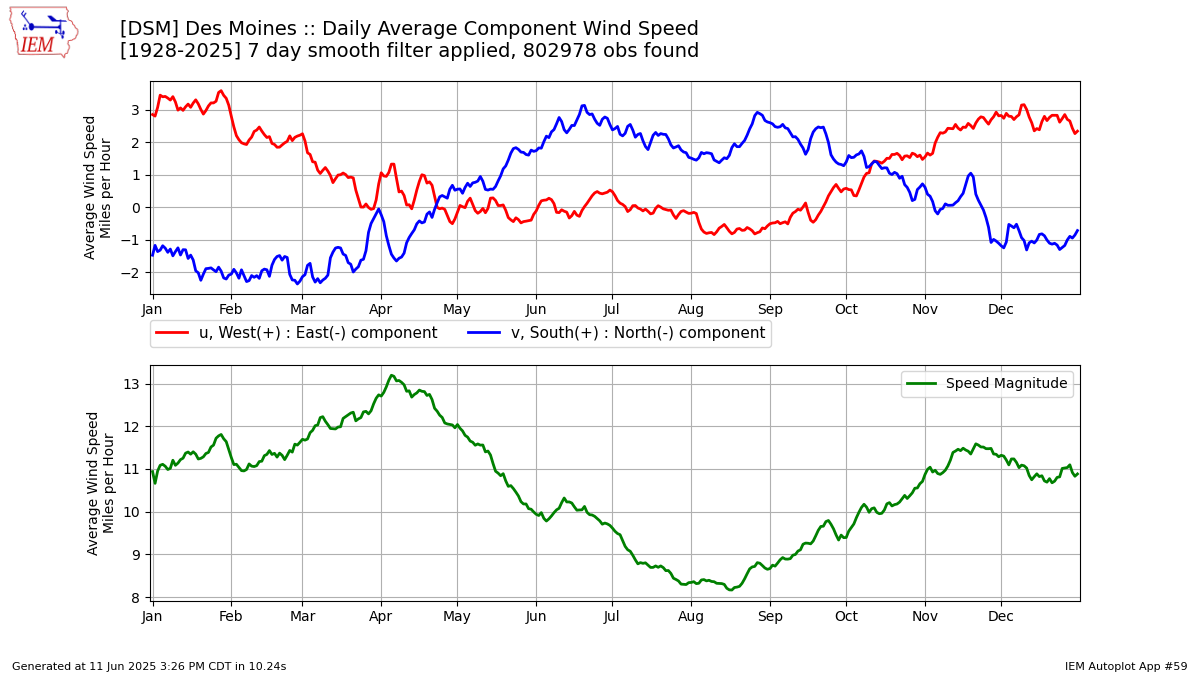
This plot presents a climatology of wind observations. The top panel presents the u (east/west) and v (north/south) components. The bottom panel is the simple average of the wind speed magnitude. The plotted information contains a seven day smoother. If you download the raw data, it will not contain this smoothing.3 Generated Chart
Based on recent timings, plot generation averages 89 seconds. Please wait while your chart is being generated...
If you notice plotting issues with the image above, please
contact us
and provide the URL address currently shown by your web browser.
IEM Daily Features using this plot
The IEM Daily Features found on this website often utilize plots found on this application. Here is a listing of features referencing this plot type.
- 19 Aug 2024: Annual Wind Speed Minimum
- 23 Mar 2022: Wind Components by Day
- 28 Jan 2020: Peak Northerlies
- 26 Apr 2018: Wind Component Climatology
- 11 Aug 2016: Wind Climatology
- 09 Sep 2010: Wind components