Automated Data Plotter
This application dynamically generates many types of graphs derived from various IEM data sources. Feel free to use these generated graphics in whatever way you wish.
1 Select a Chart Type
2 Configure Chart Options
Plot Description:
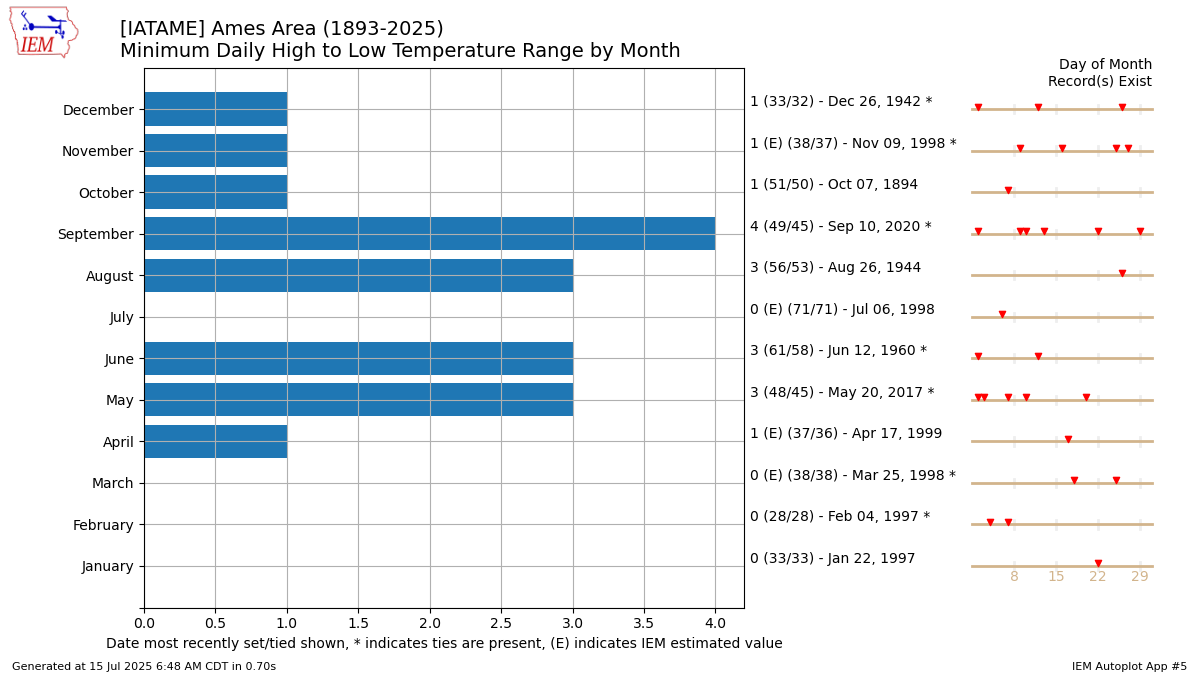
This plot displays the dates with the monthly record of your choice displayed. In the case of ties, only the most recent occurence is shown.3 Generated Chart
Based on recent timings, plot generation averages 2 seconds. Please wait while your chart is being generated...
If you notice plotting issues with the image above, please
contact us
and provide the URL address currently shown by your web browser.
IEM Daily Features using this plot
The IEM Daily Features found on this website often utilize plots found on this application. Here is a listing of features referencing this plot type.
- 22 Mar 2026: All-time March Record
- 28 Jul 2025: Tampa's first 100°F
- 24 Jun 2025: Mason City Warmest Low
- 21 May 2025: New May Daily Record
- 03 Feb 2025: January Record Tied
- 31 Oct 2024: October Max Low Record
- 27 Feb 2024: February Record Highs
- 08 Aug 2022: Sioux Falls Record Rainfall
- 13 Dec 2021: December Monthly Record
- 08 Aug 2021: La Crosse, WI Daily Record Precip
- 13 Jul 2020: Monthly High Records
- 18 May 2020: Ottumwa Tied May Record
- 03 Sep 2019: Smallest Daily Range by Month
- 24 Jan 2018: Just shy of January Record
- 06 Dec 2017: Tied December Max
- 11 Oct 2017: Can be plenty colder during October
- 27 Jan 2016: Minimum Ranges
- 08 Aug 2014: 3 Degrees in August