Automated Data Plotter
This application dynamically generates many types of graphs derived from various IEM data sources. Feel free to use these generated graphics in whatever way you wish.
1 Select a Chart Type
2 Configure Chart Options
Plot Description:
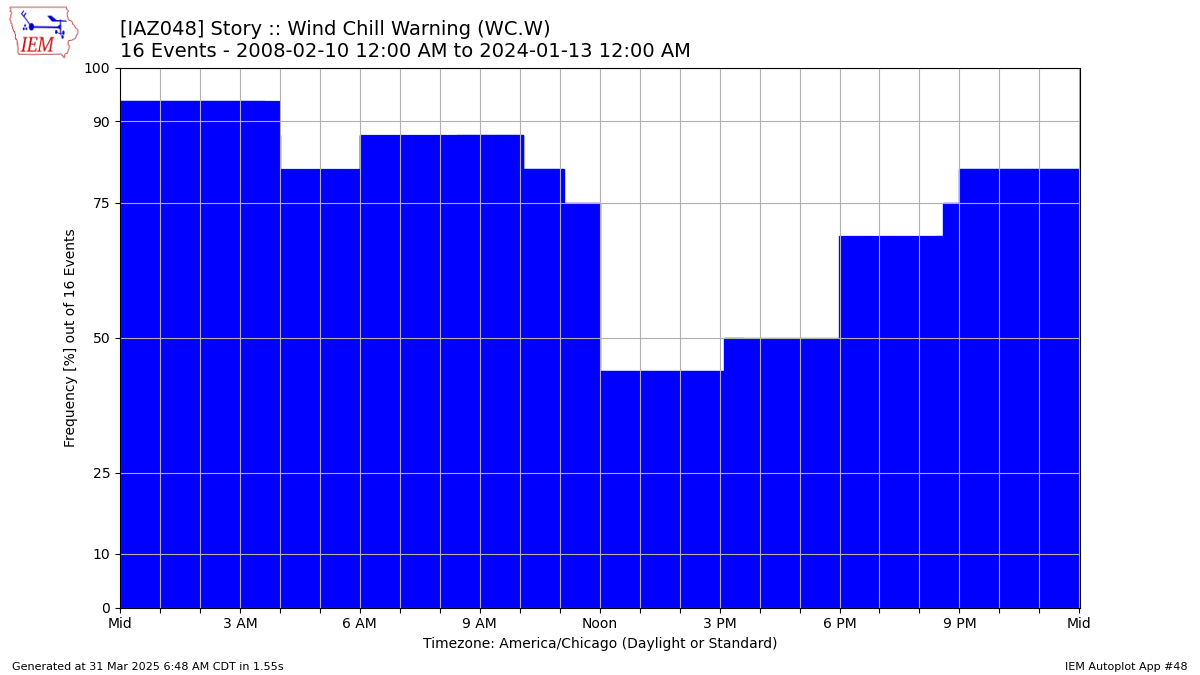
For a given watch/warning/advisory type and forecast zone, what is the frequency by time of day that the product was valid. The total number of events for the county/zone is used for the frequency. Due to how the NWS issues some products for counties and some products for zones, you may need to try twice to get the proper one selected.Autoplot 72 is similar to this, but plots for a single WFO at a time.
3 Generated Chart
Based on recent timings, plot generation averages 3 seconds. Please wait while your chart is being generated...
If you notice plotting issues with the image above, please
contact us
and provide the URL address currently shown by your web browser.
IEM Daily Features using this plot
The IEM Daily Features found on this website often utilize plots found on this application. Here is a listing of features referencing this plot type.
- 24 Apr 2026: Polk Co. Tornado Warning Timing
- 20 Nov 2024: Wind Advisory Timing
- 07 Oct 2022: Timing of Freeze Warning
- 04 Jan 2021: Dense Fog Advisory Timing
- 28 Jun 2019: Severe T'Storm Watch Timing
- 19 May 2017: Severe Thunderstorm Timing
- 07 Jan 2015: Wind Chill Warning