Automated Data Plotter
This application dynamically generates many types of graphs derived from various IEM data sources. Feel free to use these generated graphics in whatever way you wish.
1 Select a Chart Type
2 Configure Chart Options
Plot Description:
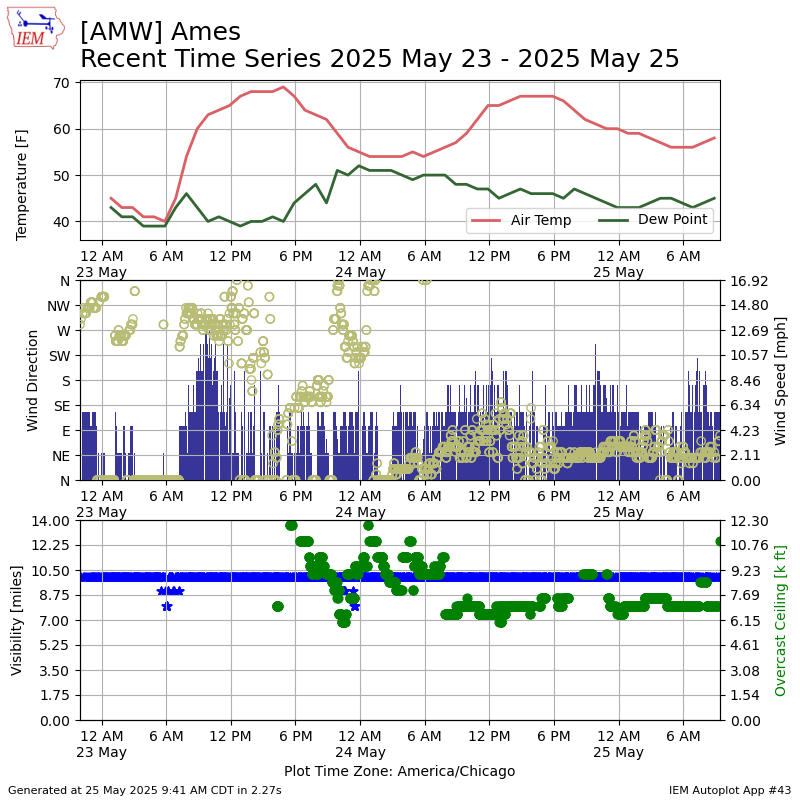
This plot presents a time series of observations. Please note the colors and axes labels used to denote which variable is which in the combination plots.3 Generated Chart
Based on recent timings, plot generation averages 3 seconds. Please wait while your chart is being generated...
If you notice plotting issues with the image above, please
contact us
and provide the URL address currently shown by your web browser.
IEM Daily Features using this plot
The IEM Daily Features found on this website often utilize plots found on this application. Here is a listing of features referencing this plot type.
- 20 Jan 2025: Weekend Dive
- 24 May 2023: Weather Three-Peat
- 18 Aug 2021: Rising Floor
- 20 Apr 2020: Welcome Weekend Warmup
- 24 Jul 2018: Small Uptick in Dew Point
- 22 Mar 2016: Rapid Rise
- 09 Dec 2009: 34 mb drop!