Automated Data Plotter
This application dynamically generates many types of graphs derived from various IEM data sources. Feel free to use these generated graphics in whatever way you wish.
1 Select a Chart Type
2 Configure Chart Options
Plot Description:
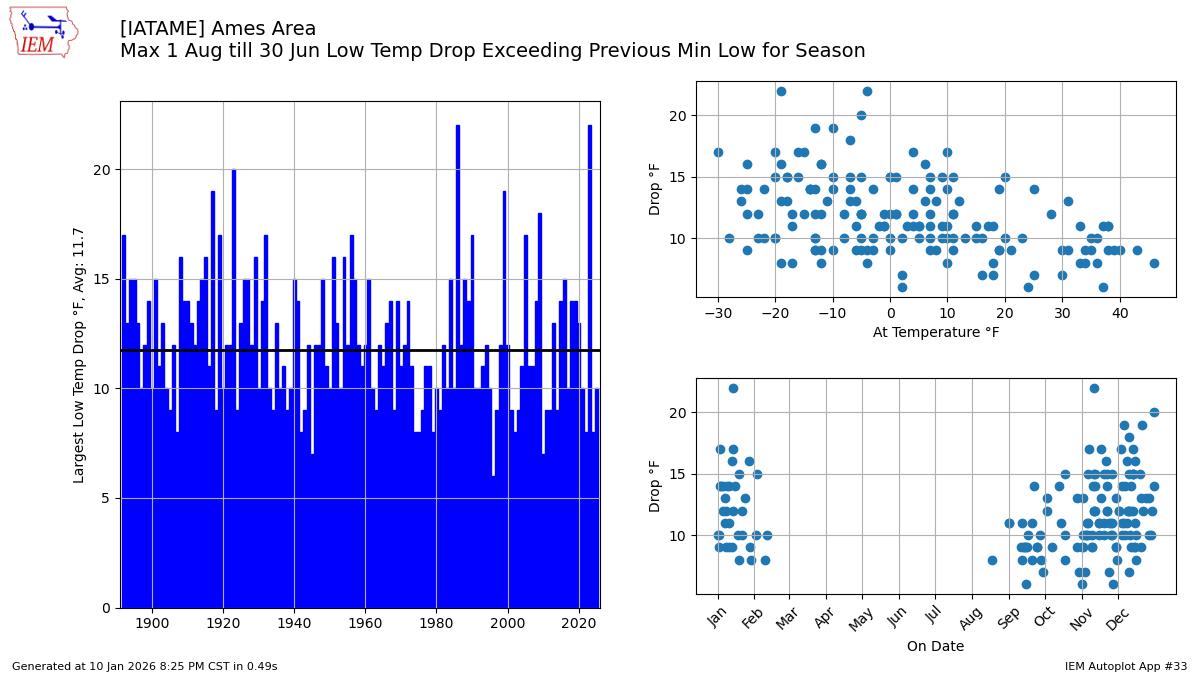
This plot presents the largest drop in low temperature during a period between 1 July and 30 June of the next year, but not including the July data of that year. The drop compares the lowest low previous to the date with the low for that date. For example, if your coldest low to date was 40, you would not expect to see a low temperature of 20 the next night without first setting colder daily low temperatures. See also autoplot 103 for more details.3 Generated Chart
Based on recent timings, plot generation averages 2 seconds. Please wait while your chart is being generated...
If you notice plotting issues with the image above, please
contact us
and provide the URL address currently shown by your web browser.
IEM Daily Features using this plot
The IEM Daily Features found on this website often utilize plots found on this application. Here is a listing of features referencing this plot type.
- 11 Nov 2021: Just 5 Degree Drop
- 16 Oct 2019: Bigger Drops to Come
- 06 Nov 2017: Larger Drops Still to Come
- 24 Nov 2015: Largest Drop
- 04 Nov 2014: Biggest Step Down