Automated Data Plotter
This application dynamically generates many types of graphs derived from various IEM data sources. Feel free to use these generated graphics in whatever way you wish.
1 Select a Chart Type
2 Configure Chart Options
Plot Description:
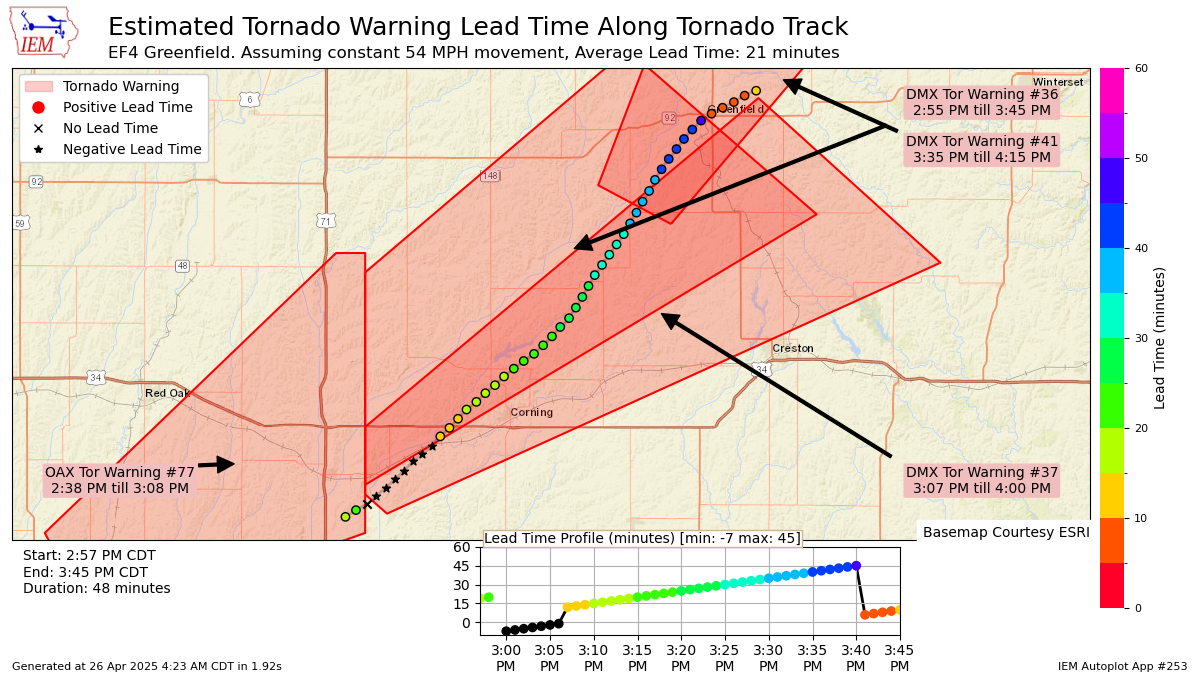
This autoplot combines NWS Damage Assessment Toolkit (DAT) tornado tracks (lines) with Tornado Warning (polygons) to provide along track estimates of lead time. This is all unofficial, of course, and makes assumptions about constant travel speed of the tornado along the track. The lead time is evaluated at 1 minute intervals and follows a method found in: Stumpf 2024: A Geospatial Verification Method for Severe Convective Weather Warnings: Implications for Current and Future Warning Methods. Points receiving a warning after observation are assigned a negative lead time. Points receiving no warning are assigned a no lead time and not considered in the lead time average.The data download option will provide the discritized points along the tornado track with the lead time in minutes.
3 Generated Chart
Based on recent timings, plot generation averages 20 seconds. Please wait while your chart is being generated...
If you notice plotting issues with the image above, please
contact us
and provide the URL address currently shown by your web browser.
IEM Daily Features using this plot
The IEM Daily Features found on this website often utilize plots found on this application. Here is a listing of features referencing this plot type.
- 06 Apr 2026: DAT Infographics
- 24 May 2024: Greenfield Tornado
- 23 May 2024: Polk-Story Tornado