Automated Data Plotter
This application dynamically generates many types of graphs derived from various IEM data sources. Feel free to use these generated graphics in whatever way you wish.
1 Select a Chart Type
2 Configure Chart Options
Plot Description:
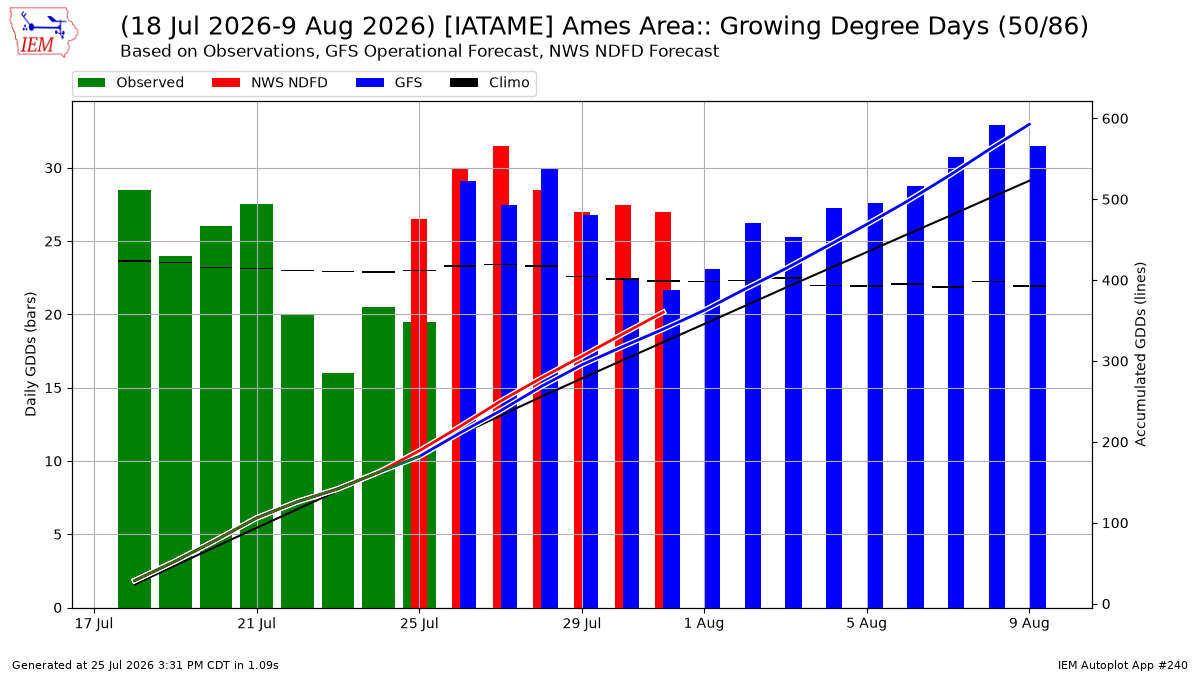
This autoplot combines growing degree day observations along with a near term forecast from the deterministic GFS and NWS NDFD models.The primary source of observations for this plot is from the NWS COOP network, but most of those observations are approximately 7 AM to 7 AM totals whereas the forecast data is approximately a calendar date. For sites that report morning data, the observations are backed up one day to better align with the forecast. This then creates a problem when running the app in the late afternoon/evening when the first forecast day is tomorrow and there is no observation for today yet. This is generally a thorny issue and why we can't have nice things.
This app uses Autoplot #9 to generate the GDD Climatology.
3 Generated Chart
Based on recent timings, plot generation averages 2 seconds. Please wait while your chart is being generated...
IEM Daily Features using this plot
The IEM Daily Features found on this website often utilize plots found on this application. Here is a listing of features referencing this plot type.
- 20 May 2026: Upcoming GDD Forecast
- 22 Apr 2025: Near term GDDs
- 26 Apr 2023: Daily GDD Forecast