Automated Data Plotter
This application dynamically generates many types of graphs derived from various IEM data sources. Feel free to use these generated graphics in whatever way you wish.
1 Select a Chart Type
2 Configure Chart Options
Plot Description:
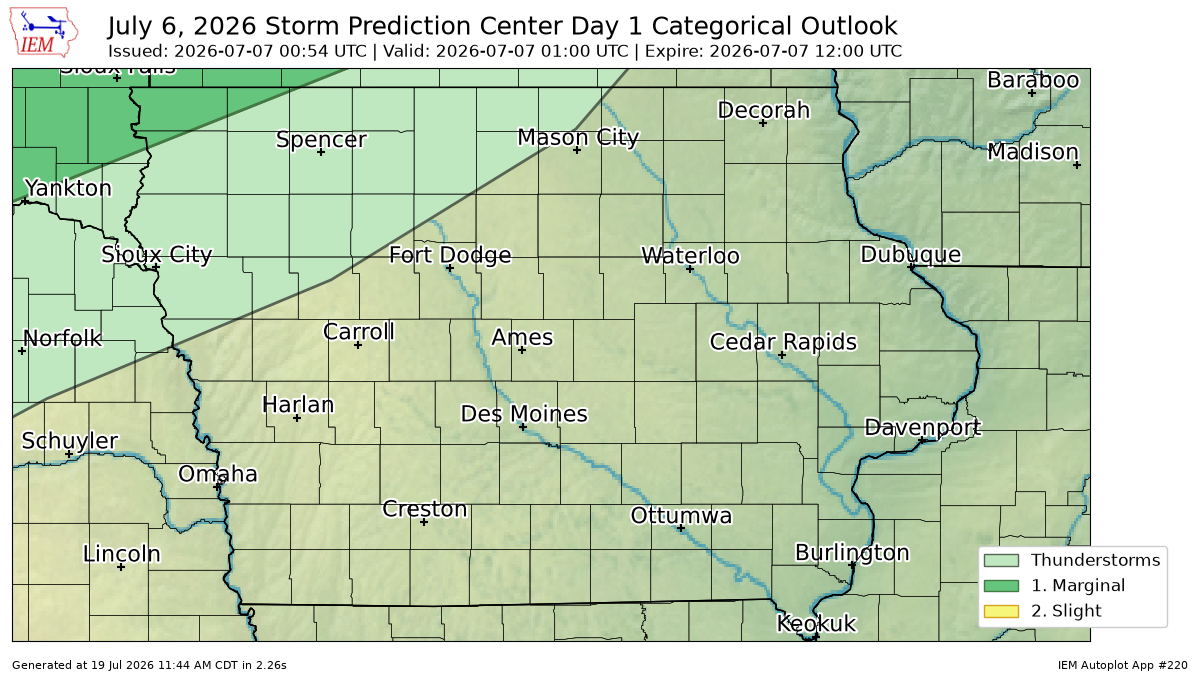
This app generates infographics for the Storm Prediction Center or Weather Prediction Center outlooks. The trick here is how the valid time works. The app will first attempt to match an issuance to that timestamp, if it fails, it then looks backwards in time for the most recent issuance to that timestamp.Another bit of ambiguity is which outlook you get between about midnight and the 13z issuance of the Day 1 Outlook. In this case and as the code stands now, you get the next day's outlook.
A GIS Shapefile download option exists for downloading these outlooks in-bulk.
3 Generated Chart
Based on recent timings, plot generation averages 4 seconds. Please wait while your chart is being generated...
IEM Daily Features using this plot
The IEM Daily Features found on this website often utilize plots found on this application. Here is a listing of features referencing this plot type.
- 02 Apr 2025: Four Days of Moderate Risks
- 04 Apr 2023: Here we go again
- 09 Aug 2021: SPC Day 2 Wind Outlook
- 28 Jul 2021: Moderate Risk over Wisconsin
- 02 Mar 2012: Large Moderate Risk
- 09 Aug 2006: 5% Tornado Threat
- 12 Sep 2005: September Severe Weather
- 26 Aug 2004: Big Fat Moderate
- 24 May 2004: Extremely Dangerous Situation.