Automated Data Plotter
This application dynamically generates many types of graphs derived from various IEM data sources. Feel free to use these generated graphics in whatever way you wish.
1 Select a Chart Type
2 Configure Chart Options
Plot Description:
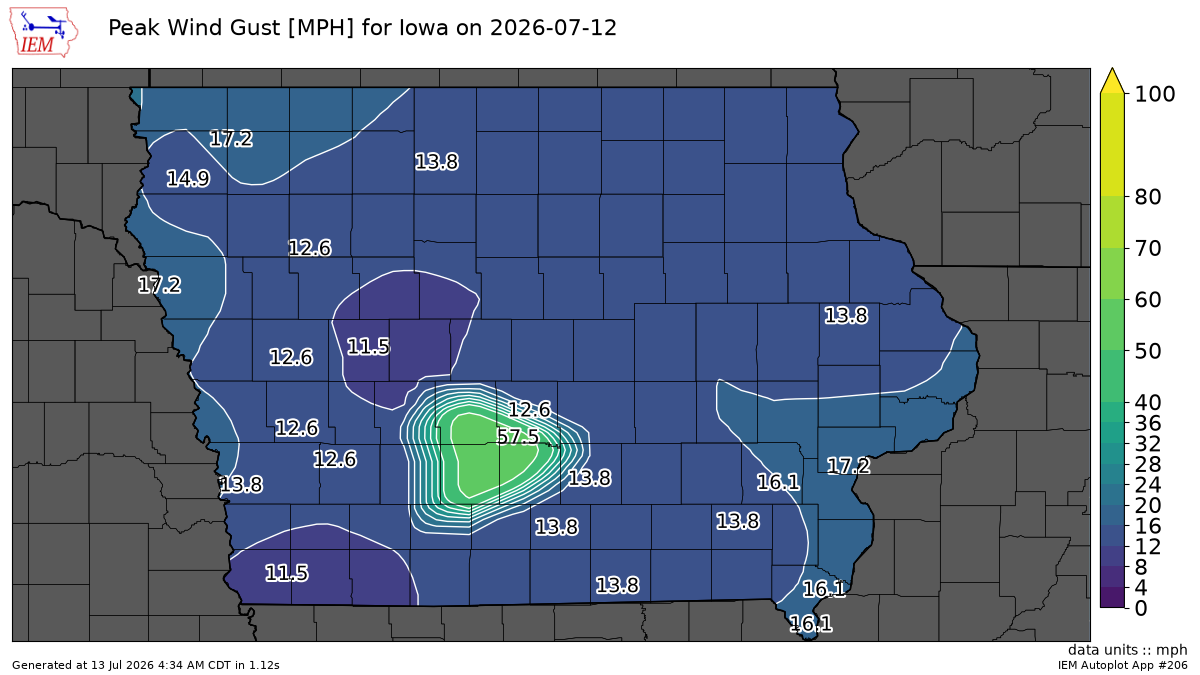
Generates analysis maps of ASOS station data for a given date.3 Generated Chart
Based on recent timings, plot generation averages 3 seconds. Please wait while your chart is being generated...
If you notice plotting issues with the image above, please
contact us
and provide the URL address currently shown by your web browser.
IEM Daily Features using this plot
The IEM Daily Features found on this website often utilize plots found on this application. Here is a listing of features referencing this plot type.
- 29 Jun 2026: Steamy Sunday
- 23 Jul 2025: High Dew Points
- 05 Dec 2024: Windy Wednesday
- 27 Aug 2024: Ugly Dew Points
- 07 Feb 2023: February Contrast
- 23 May 2022: Chilly Sunday Morning
- 08 Apr 2022: Another Windy Day
- 21 Jan 2022: Wind Chilly Thursday
- 02 Oct 2020: Coldest Morning So Far
- 10 Apr 2020: A few 60+ MPH reports