Month Limiter
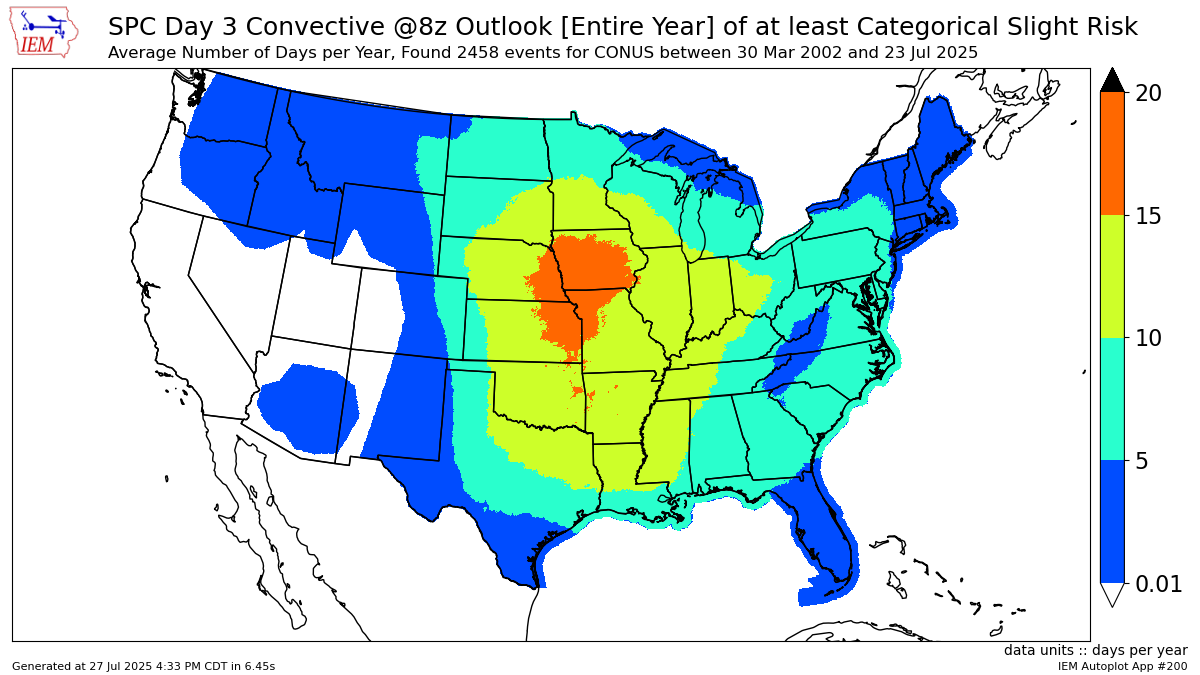
Entire Year
Spring (MAM)
Fall (SON)
Winter (DJF)
Summer (JJA)
January
February
March
April
May
June
July
August
September
October
November
December
Select SPC Product Issuance
Day 1 Convective
Day 1 Convective @1z
Day 1 Convective @20z
Day 1 Convective @16z
Day 1 Convective @13z
Day 1 Convective @6z
Day 1 Fire Weather
Day 1 Fire Weather @17z
Day 1 Fire Weather @7z
Day 1 Excessive Rainfall
Day 1 Excessive Rainfall @1z
Day 1 Excessive Rainfall @20z
Day 1 Excessive Rainfall @16z
Day 1 Excessive Rainfall @8z
Day 2 Convective
Day 2 Convective @17z
Day 2 Convective @7z
Day 2 Fire Weather
Day 2 Fire Weather @18z
Day 2 Fire Weather @8z
Day 2 Excessive Rainfall
Day 2 Excessive Rainfall @20z
Day 2 Excessive Rainfall @8z
Day 3 Convective
Day 3 Convective @20z
Day 3 Convective @8z
Day 3 Fire Weather @21z
Day 3 Excessive Rainfall @20z
Day 3 Excessive Rainfall @8z
Day 4 Convective @10z
Day 4 Excessive Rainfall @20z
Day 4 Excessive Rainfall @8z
Day 4 Fire Weather @21z
Day 5 Convective @10z
Day 5 Excessive Rainfall @20z
Day 5 Excessive Rainfall @8z
Day 5 Fire Weather @21z
Day 6 Convective @10z
Day 6 Fire Weather @21z
Day 7 Convective @10z
Day 7 Fire Weather @21z
Day 8 Convective @10z
Day 8 Fire Weather @21z
Select outlook level:
Any Severe 2% (Day 3+)
Any Severe 5% (Day 3+)
Any Severe 15% (Day 3+)
Any Severe 25% (Day 3+)
Any Severe 30% (Day 3+)
Any Severe 35% (Day 3+)
Any Severe 45% (Day 3+)
Any Severe 60% (Day 3+)
Any Severe Significant (Day 3+)
Any Severe CIG1 (Day 3+)
Any Severe CIG2 (Day 3+)
Any Severe CIG3 (Day 3+)
Categorical Thunderstorm Risk (Days 1-3)
Categorical Marginal Risk (2015+) (Days 1-3)
Categorical Slight Risk (Days 1-3)
Categorical Enhanced Risk (2015+) (Days 1-3)
Categorical Moderate Risk (Days 1-3)
Categorical High Risk (Days 1-3)
Categorical Critical Fire Wx (Days 1-2)
Categorical Extreme Fire Wx (Days 1-2)
Critical Fire Weather Area 15% (Days3-7)
Hail 5% (Days 1+2)
Hail 15% (Days 1+2)
Hail 25% (Days 1+2)
Hail 30% (Days 1+2)
Hail 35% (Days 1+2)
Hail 45% (Days 1+2)
Hail 60% (Days 1+2)
Hail Significant (Days 1+2)
Hail CIG1 (Days 1+2)
Hail CIG2 (Days 1+2)
Hail CIG3 (Days 1+2)
Tornado 2% (Days 1+2)
Tornado 5% (Days 1+2)
Tornado 10% (Days 1+2)
Tornado 15% (Days 1+2)
Tornado 25% (Days 1+2)
Tornado 30% (Days 1+2)
Tornado 35% (Days 1+2)
Tornado 45% (Days 1+2)
Tornado 60% (Days 1+2)
Tornado Significant (Days 1+2)
Tornado CIG1 (Days 1+2)
Tornado CIG2 (Days 1+2)
Tornado CIG3 (Days 1+2)
Wind 5% (Days 1+2)
Wind 15% (Days 1+2)
Wind 25% (Days 1+2)
Wind 30% (Days 1+2)
Wind 35% (Days 1+2)
Wind 45% (Days 1+2)
Wind 60% (Days 1+2)
Wind 75% (Days 1+2)
Wind 90% (Days 1+2)
Wind Significant (Days 1+2)
Wind CIG1 (Days 1+2)
Wind CIG2 (Days 1+2)
Wind CIG3 (Days 1+2)
Select plot extent type:
Plot by NWS Forecast Office
Plot by State/Sector
Plot by FEMA Region
Select WFO: (ignored if plotting state)
[ABR] Aberdeen [ till now]
[ALY] Albany [ till now]
[ABQ] Albuquerque [ till now]
[AMA] Amarillo [ till now]
[PAFC] Anchorage [ till now]
[EWX] Austin/San Antonio [ till now]
[LWX] Baltimore/Washington [ till now]
[BYZ] Billings [ till now]
[BGM] Binghamton [ till now]
[BMX] Birmingham [ till now]
[BIS] Bismarck [ till now]
[RNK] Blacksburg [ till now]
[BOI] Boise [ till now]
[BOX] Boston / Norton [ till now]
[BRO] Brownsville [ till now]
[BUF] Buffalo [ till now]
[BTV] Burlington [ till now]
[CAR] Caribou [ till now]
[CHS] Charleston [ till now]
[RLX] Charleston [ till now]
[CYS] Cheyenne [ till now]
[LOT] Chicago [ till now]
[CLE] Cleveland [ till now]
[CAE] Columbia [ till now]
[CRP] Corpus Christi [ till now]
[FWD] Dallas/Fort Worth [ till now]
[BOU] Denver [ till now]
[DMX] Des Moines [ till now]
[DTX] Detroit [ till now]
[DDC] Dodge City [ till now]
[DLH] Duluth [ till now]
[LKN] Elko [ till now]
[EPZ] El Paso [ till now]
[EKA] Eureka [ till now]
[PAFG] Fairbanks [ till now]
[FGZ] Flagstaff [ till now]
[APX] Gaylord [ till now]
[GGW] Glasgow [ till now]
[GLD] Goodland [ till now]
[FGF] Grand Forks [ till now]
[GJT] Grand Junction [ till now]
[GRR] Grand Rapids [ till now]
[GYX] Gray [ till now]
[TFX] Great Falls [ till now]
[GRB] Green Bay [ till now]
[GSP] Greenville/Spartanburg [ till now]
[PGUM] Guam [ till now]
[GID] Hastings [ till now]
[PHFO] Honolulu [ till now]
[HGX] Houston/Galveston [ till now]
[HUN] Huntsville [ till now]
[IND] Indianapolis [ till now]
[JAN] Jackson [ till now]
[JKL] Jackson [ till now]
[JAX] Jacksonville [ till now]
[PAJK] Juneau [ till now]
[EAX] Kansas City/Pleasant Hill [ till now]
[KEY] Key West [ till now]
[ARX] La Crosse [ till now]
[LCH] Lake Charles [ till now]
[VEF] Las Vegas [ till now]
[ILX] Lincoln [ till now]
[LZK] Little Rock [ till now]
[LOX] Los Angeles/Oxnard [ till now]
[LMK] Louisville [ till now]
[LUB] Lubbock [ till now]
[MQT] Marquette [ till now]
[MFR] Medford [ till now]
[MLB] Melbourne [ till now]
[MEG] Memphis [ till now]
[MFL] Miami [ till now]
[MAF] Midland/Odessa [ till now]
[MKX] Milwaukee/Sullivan [ till now]
[MSO] Missoula [ till now]
[MOB] Mobile [ till now]
[MRX] Morristown [ till now]
[PHI] Mount Holly [ till now]
[OHX] Nashville [ till now]
[LIX] New Orleans [ till now]
[MHX] Newport/Morehead City [ till now]
[OKX] New York [ till now]
[OUN] Norman [ till now]
[IWX] Northern Indiana [ till now]
[LBF] North Platte [ till now]
[OAX] Omaha / Valley [ till now]
[PAH] Paducah [ till now]
[FFC] Peachtree City [ till now]
[PDT] Pendleton [ till now]
[PSR] Phoenix [ till now]
[PBZ] Pittsburgh [ till now]
[PIH] Pocatello/Idaho Falls [ till now]
[PQR] Portland [ till now]
[PUB] Pueblo [ till now]
[DVN] Quad Cities IA IL [ till now]
[RAH] Raleigh [ till now]
[UNR] Rapid City [ till now]
[REV] Reno [ till now]
[RIW] Riverton [ till now]
[STO] Sacramento [ till now]
[SLC] Salt Lake City [ till now]
[SJT] San Angelo [ till now]
[SGX] San Diego [ till now]
[MTR] San Francisco [ till now]
[HNX] San Joaquin Valley/Hanford [ till now]
[TJSJ] San Juan [ till now]
[SEW] Seattle [ till now]
[SHV] Shreveport [ till now]
[FSD] Sioux Falls [ till now]
[OTX] Spokane [ till now]
[SGF] Springfield [ till now]
[CTP] State College [ till now]
[LSX] St Louis [ till now]
[TAE] Tallahassee [ till now]
[TBW] Tampa Bay Area / Ruskin [ till now]
[TOP] Topeka [ till now]
[TWC] Tucson [ till now]
[TSA] Tulsa [ till now]
[MPX] Twin Cities/Chanhassen [ till now]
[AKQ] Wakefield [ till now]
[ICT] Wichita [ till now]
[ILM] Wilmington [ till now]
[ILN] Wilmington [ till now]
Show Map
Click dot to select in form above.
Key
Online
Offline
Select state/sector to plot
Alaska
Alabama
American Somoa
Arkansas
Arizona
California
Colorado
Connecticut
District of Columbia
Delaware
Florida
Georgia
Guam
Hawaii
Iowa
Idaho
Illinois
Indiana
Kansas
Kentucky
Louisiana
Massachusetts
Maryland
Maine
Michigan
Minnesota
Missouri
Mississippi
Montana
North Carolina
North Dakota
Nebraska
New Hampshire
New Jersey
New Mexico
Nevada
New York
Ohio
Oklahoma
Oregon
Pennsylvania
Puerto Rico
Rhode Island
South Carolina
South Dakota
Tennessee
Texas
Utah
Virginia
Virgin Islands
Vermont
Washington
Wisconsin
West Virginia
Wyoming
Contiguous US
Corn Belt US
High Plains
IA + IL + IN
IA + IL + MO
Midwestern US
Northeastern US
Southern New England
Northwestern US
Southeast US
Southern Plains US
Southwestern US
Select FEMA Region:
[1] Region 1 {ME,NH,VT,MA,CT,RI}
[2] Region 2 {NY,NJ,PR,VI}
[3] Region 3 {MD,PA,WV,DC,DE,VA}
[4] Region 4 {NC,SC,GA,FL,AL,MS,TN,KY}
[5] Region 5 {IL,IN,OH,MI,WI,MN}
[6] Region 6 {NM,TX,OK,LA,AR}
[7] Region 7 {NE,IA,KS,MO}
[8] Region 8 {MT,ND,SD,WY,UT,CO}
[9] Region 9 {NV,AZ,CA,FSM,GU,HI,RMI,CNMI,AS}
[10] Region 10 {AK,WA,OR,ID}
Plot County/Parish borders on maps?
YES: Draw Counties/Parishes
NO: Do Not Draw Counties/Parishes
Which metric to plot?
Average Number of Days per Year
Total Number of Days
Year of Last Issuance
Optionally limit plot to this end date:
Limit plot to the inclusive start day of the year. If this value is greater than end date, plot will run over winter / Jan 1.
Limit plot to the inclusive end day of the year. If this value is less than start date, plot will run over winter / Jan 1.
Image Pixel Size @100 DPI
1024x768 (4:3)
800x600 (4:3)
800x800 (1:1)
900x600 (3:2)
Twitter Friendly (1200x675)
1280x720 (16:9)
Select Output Format:
Chart Image (.PNG)
Scalable Vector Graphic (.SVG)
Portable Document Format (.PDF)