Automated Data Plotter
This application dynamically generates many types of graphs derived from various IEM data sources. Feel free to use these generated graphics in whatever way you wish.
1 Select a Chart Type
2 Configure Chart Options
Plot Description:
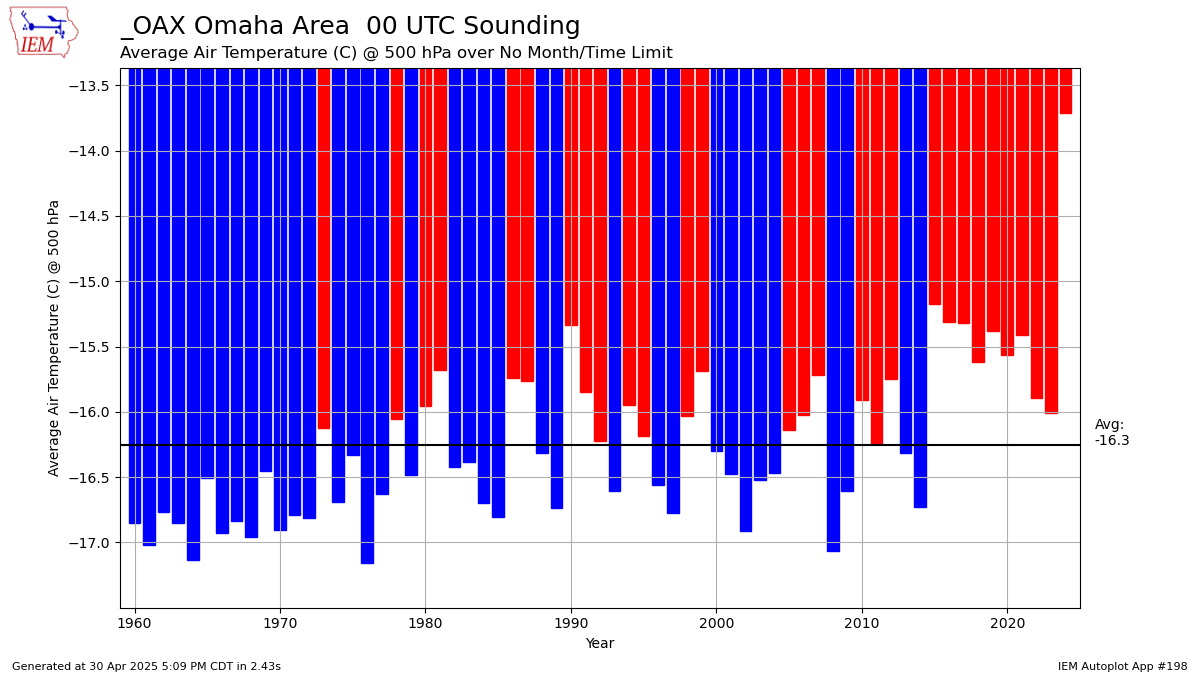
This plot presents a simple average of a given sounding variable of your choice. If the selected month period crosses a calendar year, the year shown is for the January included in the period.The 'Select Station' option provides some 'virtual' stations that are spliced together archives of close by stations. For some locations, the place that the sounding is made has moved over the years..
Some derived parameters are a work-in-progress.
3 Generated Chart
Based on recent timings, plot generation averages 4 seconds. Please wait while your chart is being generated...
If you notice plotting issues with the image above, please
contact us
and provide the URL address currently shown by your web browser.
IEM Daily Features using this plot
The IEM Daily Features found on this website often utilize plots found on this application. Here is a listing of features referencing this plot type.
- 12 Nov 2024: Fall Winds Aloft
- 28 Apr 2022: Windy Aloft Too
- 30 Jun 2020: Weak Flow
- 18 Jul 2018: High 500hPa Heights