Automated Data Plotter
This application dynamically generates many types of graphs derived from various IEM data sources. Feel free to use these generated graphics in whatever way you wish.
1 Select a Chart Type
2 Configure Chart Options
Plot Description:
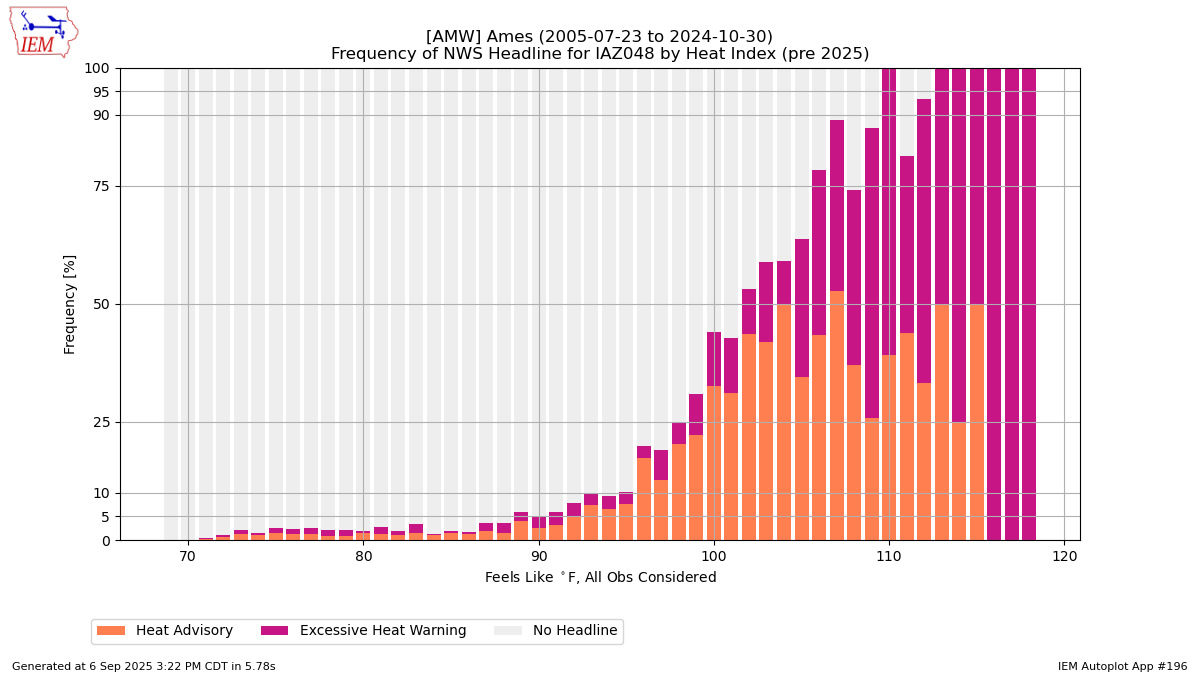
This plot presents a frequency of having either a heat index or wind chill advisory/warning active for a given computed feels like temperature. The major caveat with this plot is that it does not address the duration requirement that these alerts carry with them. For example, instantaneously dipping to a wind chill of -20 does not necessarily necessitate a wind chill advisory be issued. Another tunable knob to this application is to only consider 'additive' cases. That being when the wind chill is colder than the air temperature and when the heat index is higher than the air temperature. In the case of wind chill, a calm wind can lead to a nebulous wind chill. Similiarly, a low humidity to what the computed heat index is.For the winter season of 2024-2025, the National Weather Service changed to issue Extreme Cold Warning and Cold Weather Advisory instead of Wind Chill Advisories/Warnings.
For the 2025 summer season, the National Weather Service changed to issue Extreme Heat Warning instead of an Excessive Heat Warning.
The plot shows the NWS headline frequency for the forecast zone that the automated weather station resides in.
3 Generated Chart
Based on recent timings, plot generation averages 9 seconds. Please wait while your chart is being generated...
IEM Daily Features using this plot
The IEM Daily Features found on this website often utilize plots found on this application. Here is a listing of features referencing this plot type.
- 25 Jul 2024: Ames Heat Headlines
- 26 Jan 2022: Cedar Rapids Wind Chill Warning
- 16 Jan 2020: Wind Chill Headlines
- 12 Jul 2018: Heat Headlines