Automated Data Plotter
This application dynamically generates many types of graphs derived from various IEM data sources. Feel free to use these generated graphics in whatever way you wish.
1 Select a Chart Type
2 Configure Chart Options
Plot Description:
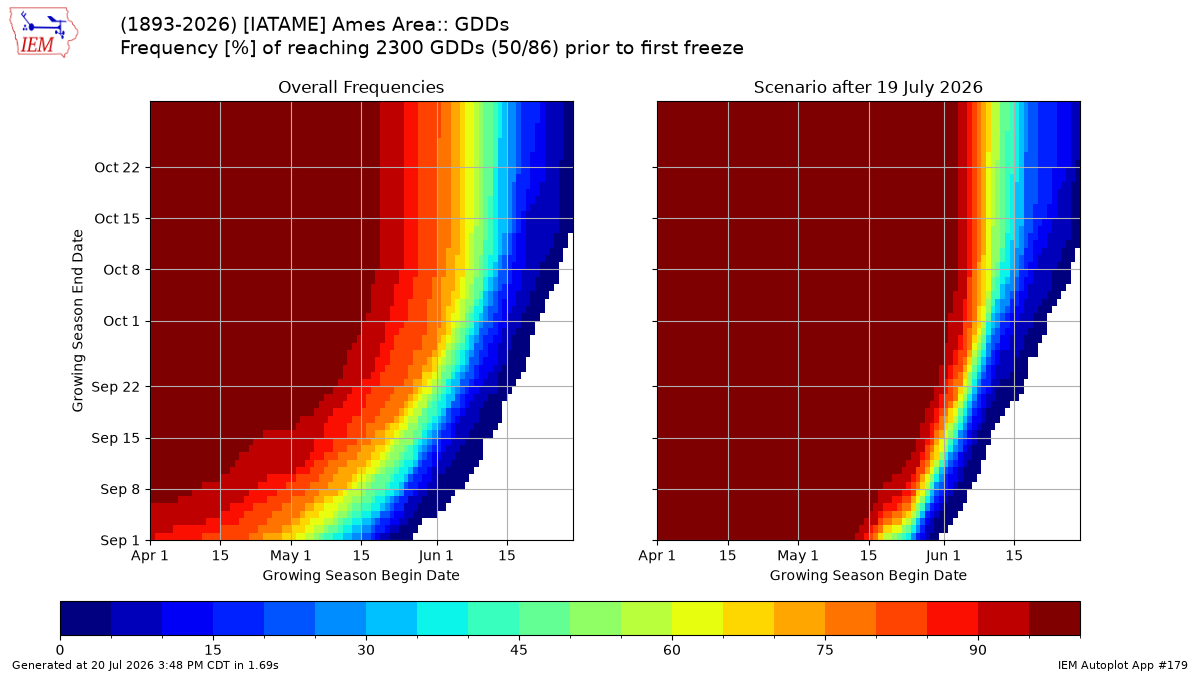
This application creates two 2-D histograms of GDD accumulation frequencies. These frequencies are based on historical data for the specificed site and base the end of each year's growing season on the first sub freezing temperature of the fall. The left hand plot shows the overall frequency based on each year's data. The right hand plot does a scenario using the combination of year to date data for this year and then each previous year afterwards is appended to this year's data to provide frequencies. The right hand plot is meant to provide current frequencies / probabilities of what could potentially happen this year.3 Generated Chart
Based on recent timings, plot generation averages 2 seconds. Please wait while your chart is being generated...
If you notice plotting issues with the image above, please
contact us
and provide the URL address currently shown by your web browser.
IEM Daily Features using this plot
The IEM Daily Features found on this website often utilize plots found on this application. Here is a listing of features referencing this plot type.
- 05 Aug 2025: Reaching 2400 GDDs
- 30 Aug 2023: Completing the Growing Season
- 22 Sep 2021: Few Degree Day Worries
- 27 Apr 2021: Time to Plant
- 04 Jun 2019: Trouble with Planting Late
- 20 Jun 2017: GDD Probabilities
- 08 Aug 2013: Reaching 2600 GDDs