Automated Data Plotter
This application dynamically generates many types of graphs derived from various IEM data sources. Feel free to use these generated graphics in whatever way you wish.
1 Select a Chart Type
2 Configure Chart Options
Plot Description:
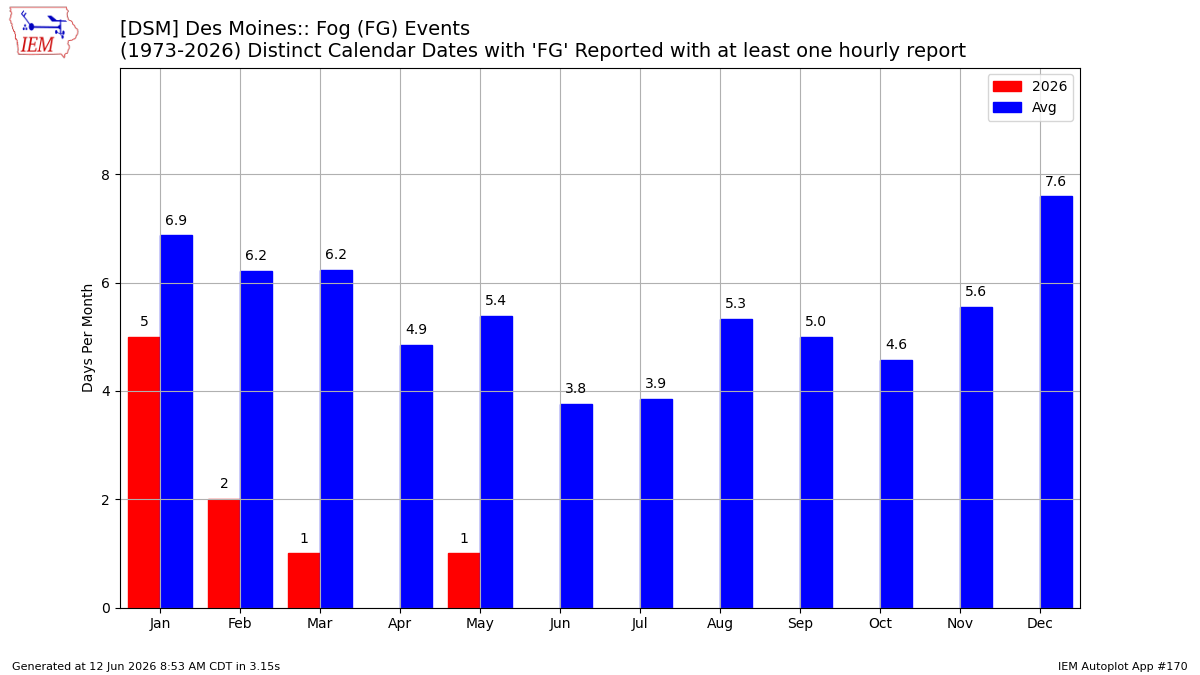
This chart totals the number of distinct calendar days or hours per month that a given present weather condition is reported within the METAR data feed. The calendar day is computed for the local time zone of the reporting station.The reporting of present weather codes within METARs has changed over the years and there is some non-standard nomenclature used by some sites. The thunder (TS) reports are delineated into three categories here to hopefully allow more accurate statistics.
- All Thunder Reports (TS) includes any
TSmention in any present weather code - Thunder in Vicinity (VCTS) includes any
VCTSmention in any present weather code, for example,VCTSRAwould match. - Thunder Reports (excluding VCTS) includes most
TSmentions, but not any includingVC
This autoplot considers both routine and special hourly reports.
3 Generated Chart
Based on recent timings, plot generation averages 14 seconds. Please wait while your chart is being generated...
IEM Daily Features using this plot
The IEM Daily Features found on this website often utilize plots found on this application. Here is a listing of features referencing this plot type.
- 14 Mar 2025: Monthly Thunder Hours
- 22 Jun 2023: Milwaukee Streak without Thunder
- 24 Jan 2023: January Fog Days
- 13 Jun 2021: Just One Hour
- 06 Aug 2020: Awaiting August Thunder
- 04 Apr 2020: Freezing Rain Reports
- 22 Jan 2020: Light Snow Days
- 12 Jun 2019: No June Thunder Yet
- 14 Nov 2017: Days with Fog Reported
- 28 Jun 2017: Peak Thunder
- 23 Dec 2016: Rare December Thunder
- 25 Nov 2016: Light Snow Reports