Automated Data Plotter
This application dynamically generates many types of graphs derived from various IEM data sources. Feel free to use these generated graphics in whatever way you wish.
1 Select a Chart Type
2 Configure Chart Options
Plot Description:
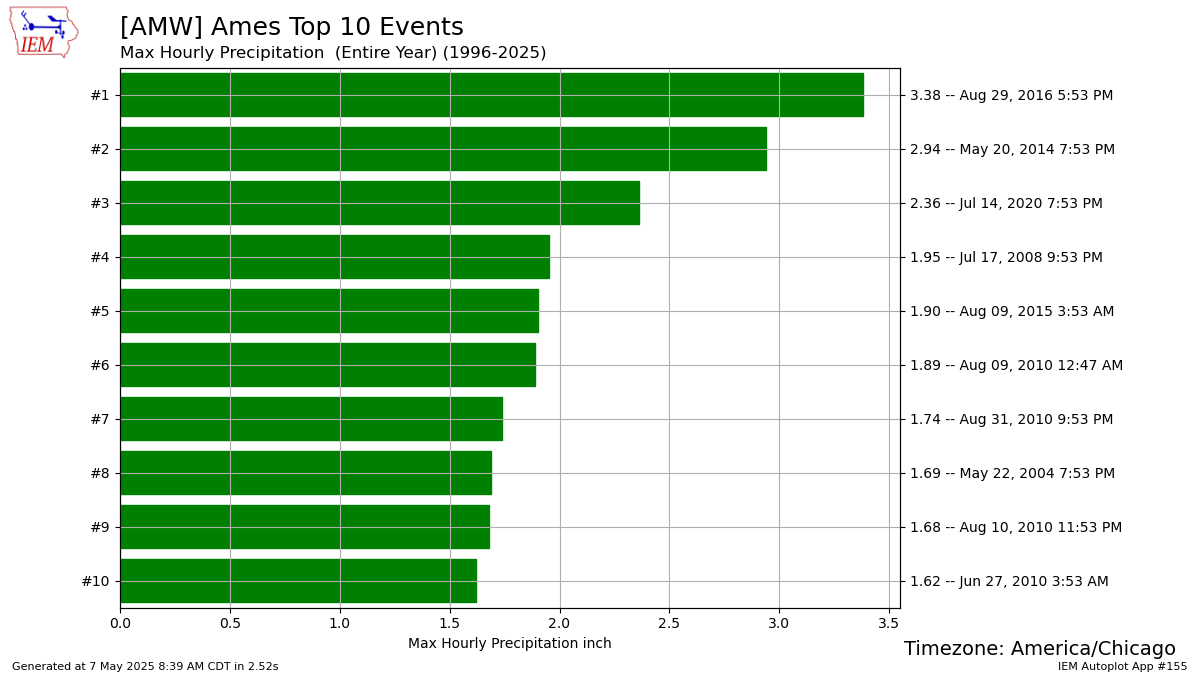
Based on available hourly observation reports by METAR stations, this application presents the top 10 events for a given metric of your choice. Please note that this application often reveals bad data stored within the database. Please do contact us when you see suspicious reports and we'll clean up the database.You can optionally generate this plot for an explicit period of days, the year is ignored with only the month and day portion used. If you set the start date to a date later than the end date, then the effect is to consider the date period crossing 1 January.
If you pick the same start and end date, you effectively get the extremes for that date.
The CSV/Excel download option for this autoplot will return 500 unfiltered events for further usage as you see fit.
3 Generated Chart
Based on recent timings, plot generation averages 10 seconds. Please wait while your chart is being generated...
IEM Daily Features using this plot
The IEM Daily Features found on this website often utilize plots found on this application. Here is a listing of features referencing this plot type.
- 18 Jun 2026: Minimum June Pressure
- 10 Mar 2025: Min March Pressure
- 02 Aug 2024: Top Summer Hourly Precip
- 06 Feb 2023: Mount Washington Wind Chill
- 02 Sep 2021: Newark, NJ Precipitation
- 15 Jul 2020: Top Hourly Precip Events
- 01 Oct 2019: Too hot for September 30
- 07 Jun 2018: Top June Hourly Rainfalls
- 31 Aug 2016: Largest Hourly Totals
- 16 Aug 2016: Max Hourly Precip Reports