Automated Data Plotter
This application dynamically generates many types of graphs derived from various IEM data sources. Feel free to use these generated graphics in whatever way you wish.
1 Select a Chart Type
2 Configure Chart Options
Plot Description:
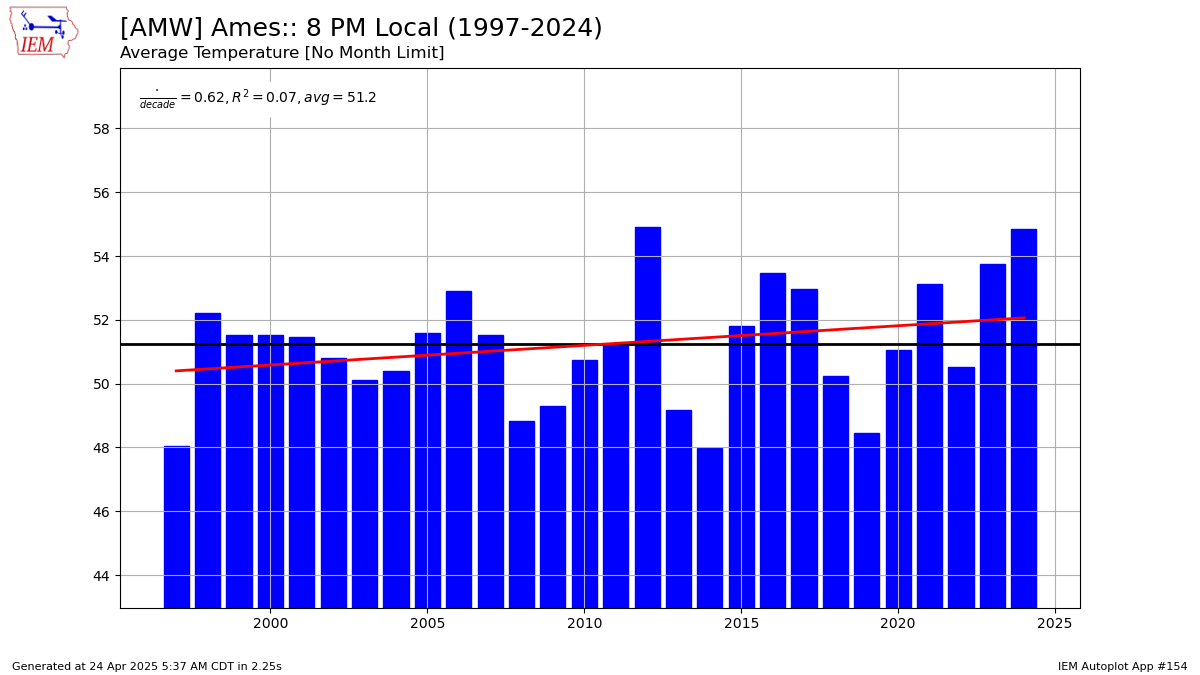
This chart presents an average hourly value for a given month or season over the years covering the period of record for the site. For the year to plot, at least 80% data availability needs to be obtained.3 Generated Chart
Based on recent timings, plot generation averages 6 seconds. Please wait while your chart is being generated...
If you notice plotting issues with the image above, please
contact us
and provide the URL address currently shown by your web browser.
IEM Daily Features using this plot
The IEM Daily Features found on this website often utilize plots found on this application. Here is a listing of features referencing this plot type.
- 07 Jul 2025: 3 PM July Temps
- 15 May 2023: Chilly Afternoon for May
- 05 Jul 2021: 10 PM Temps during July
- 26 Nov 2019: Avg Noon November Temps
- 25 Apr 2018: April 4 PM Temps
- 09 Aug 2016: 4 PM 80 degrees in August