Automated Data Plotter
This application dynamically generates many types of graphs derived from various IEM data sources. Feel free to use these generated graphics in whatever way you wish.
1 Select a Chart Type
2 Configure Chart Options
Plot Description:
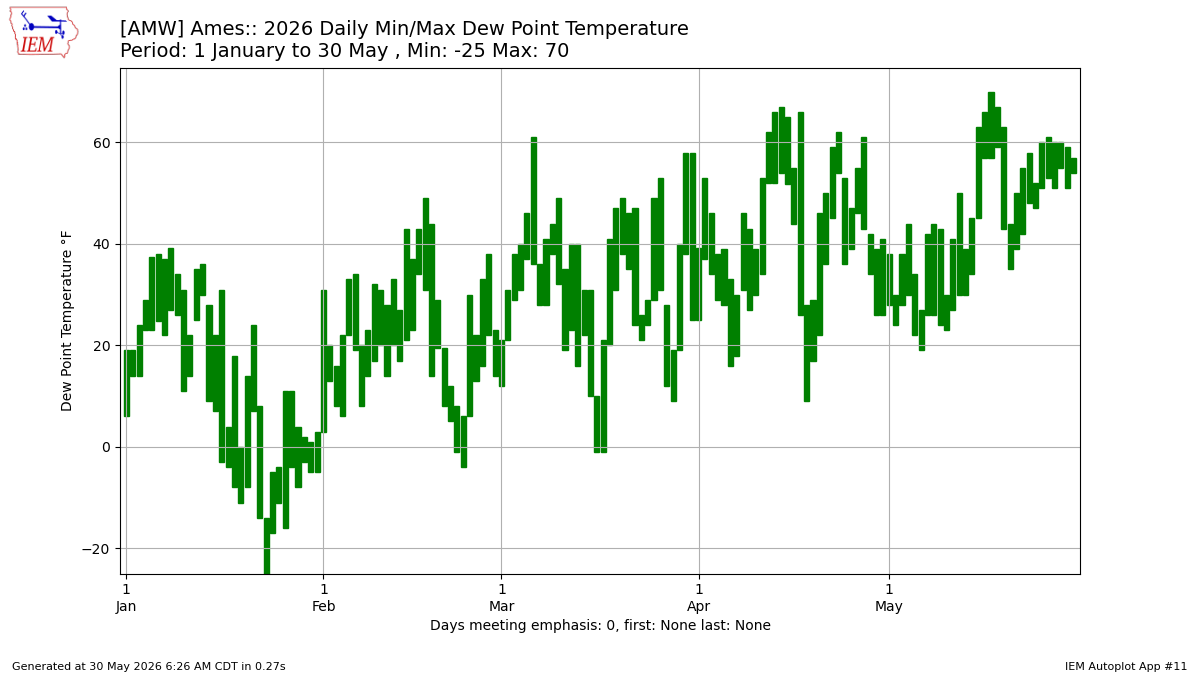
This plot presents the range between the min and maximum observation of your choice for a given station and a given year. Some of these values are only computed based on hourly reports, so they would be represent a true min and max of a continuously observed variable.3 Generated Chart
Based on recent timings, plot generation averages 2 seconds. Please wait while your chart is being generated...
If you notice plotting issues with the image above, please
contact us
and provide the URL address currently shown by your web browser.
IEM Daily Features using this plot
The IEM Daily Features found on this website often utilize plots found on this application. Here is a listing of features referencing this plot type.
- 24 Jun 2026: 2026 Daily Dew Point Range
- 19 Feb 2025: Sub -30°F Wind Chills
- 22 Nov 2024: Sub 20°F Wind Chills
- 14 Jun 2024: First 90+ Feels Like
- 29 Aug 2022: Sticky Air Return
- 07 Jun 2022: 65+ Dew Points
- 24 May 2021: 60+ Degree Dew Points
- 29 Jun 2020: High Humidity is Here
- 28 Feb 2019: All Day below 10
- 27 Aug 2018: Uncomfortable Humidity Returns
- 30 Jul 2018: Respite from the Heat
- 02 May 2018: Finally, some humidity
- 21 Mar 2018: Only Two Days with 40+ Dew Points
- 06 Jul 2016: Reached 80
- 25 Apr 2016: Not much for high dew points
- 01 Sep 2015: Humidity Returns
- 15 Jul 2015: Daily Dew Points
- 04 May 2015: 60 Degree Dew Point
- 25 Aug 2014: Daily Max Dew Points
- 16 Aug 2010: Finally, some fair weather